## Chart Type: Line Graphs
### Overview
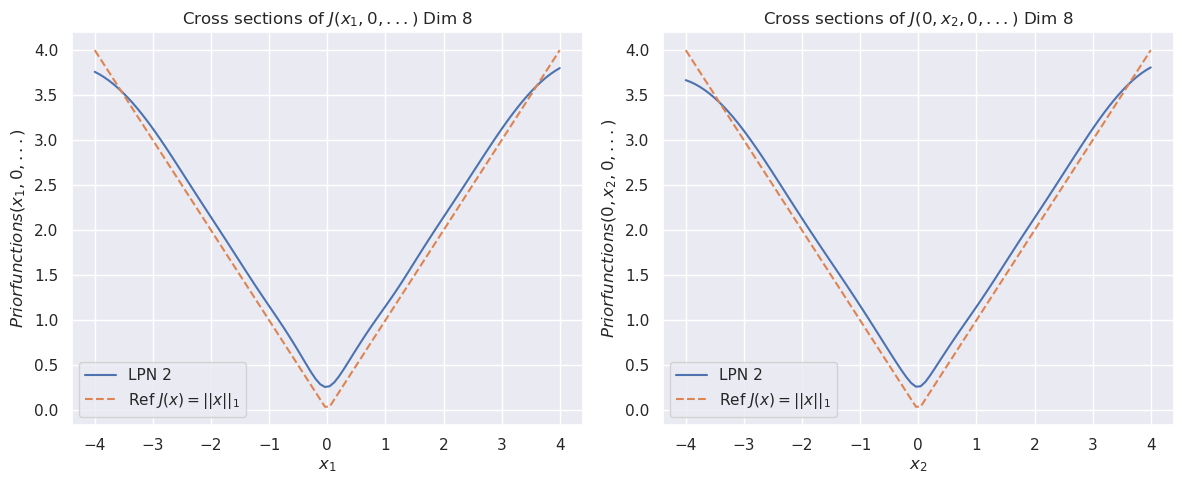
The image contains two line graphs, each displaying cross-sections of a function J with respect to a single variable (x1 and x2, respectively) while other variables are held at zero. Both graphs compare the function "LPN 2" (solid blue line) against a reference function "Ref J(x) = ||x||1" (dashed orange line). The graphs are labeled "Cross sections of J(x1, 0,...) Dim 8" and "Cross sections of J(0, x2, 0,...) Dim 8".
### Components/Axes
* **Titles:**
* Left Graph: "Cross sections of J(x1, 0,...) Dim 8"
* Right Graph: "Cross sections of J(0, x2, 0,...) Dim 8"
* **Y-Axis:**
* Label (both graphs): "Priorfunctions(x1, 0, ...)" (left) and "Priorfunctions(0, x2, 0, ...)" (right)
* Scale: 0.0 to 4.0, with tick marks at intervals of 0.5.
* **X-Axis:**
* Label (both graphs): "x1" (left) and "x2" (right)
* Scale: -4 to 4, with tick marks at intervals of 1.
* **Legend:** Located in the bottom-left corner of each graph.
* Blue solid line: "LPN 2"
* Orange dashed line: "Ref J(x) = ||x||1"
### Detailed Analysis
**Left Graph: Cross sections of J(x1, 0,...) Dim 8**
* **LPN 2 (Blue Solid Line):**
* Trend: Starts at approximately (x1=-4, y=3.7), decreases to a minimum around (x1=0, y=0.1), then increases to approximately (x1=4, y=3.7). The curve is smooth.
* Data Points (approximate):
* (-4, 3.7)
* (-3, 2.5)
* (-2, 1.3)
* (-1, 0.5)
* (0, 0.1)
* (1, 0.5)
* (2, 1.3)
* (3, 2.5)
* (4, 3.7)
* **Ref J(x) = ||x||1 (Orange Dashed Line):**
* Trend: Starts at (x1=-4, y=4), decreases linearly to (x1=0, y=0), then increases linearly to (x1=4, y=4).
* Data Points:
* (-4, 4)
* (-3, 3)
* (-2, 2)
* (-1, 1)
* (0, 0)
* (1, 1)
* (2, 2)
* (3, 3)
* (4, 4)
**Right Graph: Cross sections of J(0, x2, 0,...) Dim 8**
* **LPN 2 (Blue Solid Line):**
* Trend: Starts at approximately (x2=-4, y=3.7), decreases to a minimum around (x2=0, y=0.1), then increases to approximately (x2=4, y=3.7). The curve is smooth.
* Data Points (approximate):
* (-4, 3.7)
* (-3, 2.5)
* (-2, 1.3)
* (-1, 0.5)
* (0, 0.1)
* (1, 0.5)
* (2, 1.3)
* (3, 2.5)
* (4, 3.7)
* **Ref J(x) = ||x||1 (Orange Dashed Line):**
* Trend: Starts at (x2=-4, y=4), decreases linearly to (x2=0, y=0), then increases linearly to (x2=4, y=4).
* Data Points:
* (-4, 4)
* (-3, 3)
* (-2, 2)
* (-1, 1)
* (0, 0)
* (1, 1)
* (2, 2)
* (3, 3)
* (4, 4)
### Key Observations
* Both graphs are nearly identical, suggesting symmetry in the function J with respect to x1 and x2 when other variables are zero.
* The "LPN 2" function (blue line) deviates from the reference function "Ref J(x) = ||x||1" (orange dashed line), particularly near x1=0 and x2=0, where "LPN 2" exhibits a smoother, rounded minimum.
* The reference function is a simple absolute value function, while "LPN 2" appears to be a smoothed version of it.
### Interpretation
The graphs illustrate the behavior of the "LPN 2" function in comparison to a reference function, the L1 norm, along two dimensions (x1 and x2) while keeping the other dimensions at zero. The "LPN 2" function approximates the L1 norm but introduces a smoothing effect around the origin. This smoothing might be a desirable property in certain applications, as it can make the function more amenable to optimization algorithms that rely on gradient information. The symmetry between the two graphs suggests that the function J is likely symmetric with respect to the first two variables when the others are zero. The dimension is 8, which means there are 6 other variables being held constant at 0.