## Chart: Cross Sections of J(x₁, 0, ...) Dim 8 & J(0, x₂, 0, ...) Dim 8
### Overview
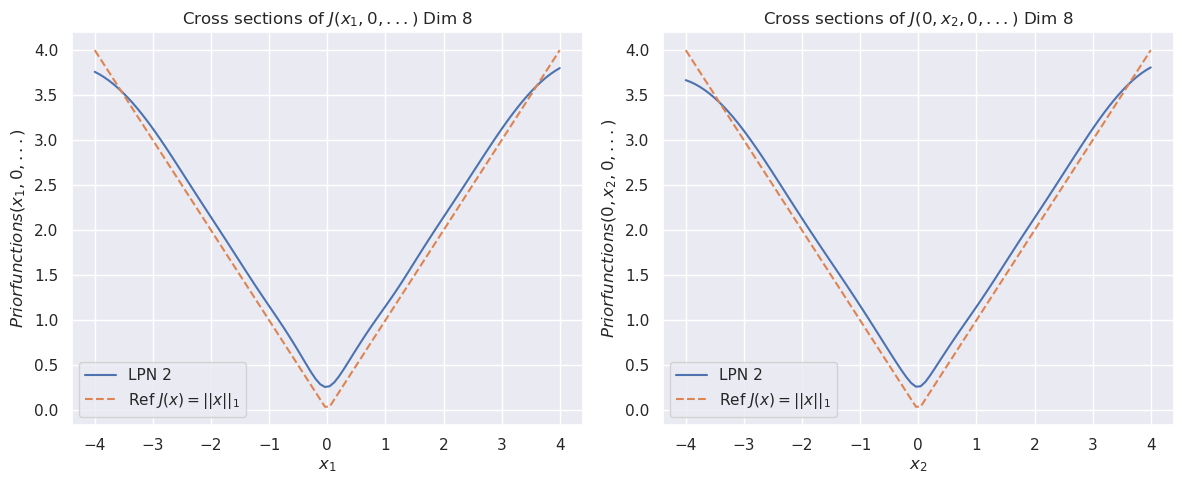
The image presents two line charts, side-by-side, visualizing cross-sections of a function J in 8 dimensions. The left chart displays the cross-section with respect to x₁, while the right chart shows the cross-section with respect to x₂. Both charts compare two prior functions: "LPN 2" and "Ref/f(x) = ||x||₁". Both charts share the same y-axis scale and similar x-axis scales.
### Components/Axes
* **Title (Left Chart):** "Cross sections of J(x₁, 0, ...)"
* **Title (Right Chart):** "Cross sections of J(0, x₂, 0, ...)"
* **X-axis Label (Both Charts):** x₁ (Left) and x₂ (Right)
* **Y-axis Label (Both Charts):** "Priorfunctions(x₁, 0, ...)" (Left) and "Priorfunctions(0, x₂, ...)" (Right)
* **Y-axis Scale (Both Charts):** 0.0 to 4.0, with increments of 0.5.
* **X-axis Scale (Both Charts):** -4.0 to 4.0, with increments of 1.0.
* **Legend (Both Charts):**
* "LPN 2" - represented by a solid blue line.
* "Ref/f(x) = ||x||₁" - represented by a dashed orange line.
### Detailed Analysis or Content Details
**Left Chart (x₁):**
* **LPN 2 (Blue Line):** The line starts at approximately (-4.0, 3.8), decreases to a minimum of approximately (-0.2, 0.2), and then increases to approximately (4.0, 3.8). The curve is roughly symmetrical around the y-axis.
* **Ref/f(x) = ||x||₁ (Orange Dashed Line):** The line starts at approximately (-4.0, 0.1), increases linearly to (0.0, 0.0), and then increases linearly to approximately (4.0, 4.0). This forms a V-shape centered at the origin.
**Right Chart (x₂):**
* **LPN 2 (Blue Line):** The line starts at approximately (-4.0, 3.8), decreases to a minimum of approximately (-0.2, 0.2), and then increases to approximately (4.0, 3.8). The curve is roughly symmetrical around the y-axis.
* **Ref/f(x) = ||x||₁ (Orange Dashed Line):** The line starts at approximately (-4.0, 0.1), increases linearly to (0.0, 0.0), and then increases linearly to approximately (4.0, 4.0). This forms a V-shape centered at the origin.
### Key Observations
* Both charts exhibit similar behavior for the "LPN 2" function.
* The "Ref/f(x) = ||x||₁" function consistently shows a linear increase from 0.0 at the origin to 4.0 at x = ±4.0.
* The "LPN 2" function appears to be a smoothed approximation or transformation of the "Ref/f(x) = ||x||₁" function.
* Both functions are symmetrical around the y-axis.
### Interpretation
The charts demonstrate the behavior of two prior functions in the context of an 8-dimensional function J. The "Ref/f(x) = ||x||₁" function represents the L1 norm, which is a measure of the sum of the absolute values of the components of a vector. The "LPN 2" function appears to be a modified or regularized version of the L1 norm, potentially designed to provide a smoother or more stable prior distribution.
The cross-sections reveal how these prior functions influence the behavior of J along the x₁ and x₂ dimensions. The L1 norm encourages sparsity (i.e., many components of the vector being zero), while the "LPN 2" function may introduce a degree of smoothness or non-sparsity.
The symmetry around the y-axis suggests that the function J and its prior functions are invariant to changes in the sign of x₁ and x₂. The fact that both charts are nearly identical suggests that the function J is not strongly dependent on the specific dimension (x₁ or x₂).