## Line Charts: Cross Sections of a Prior Function in 8 Dimensions
### Overview
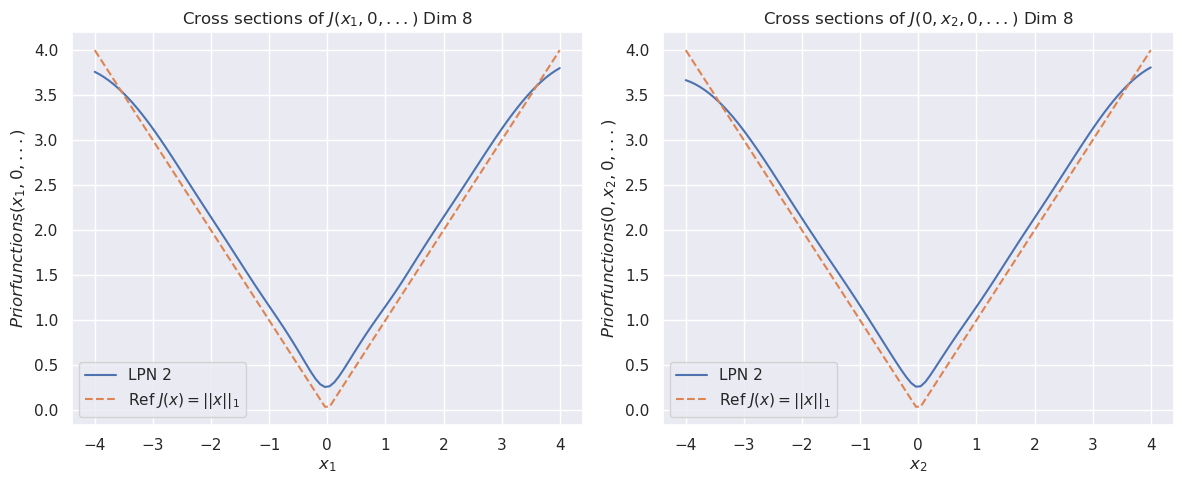
The image displays two side-by-side line charts. Both plots show cross-sections of a function labeled `J` in an 8-dimensional space. The left chart examines the function's behavior as the first variable (`x₁`) changes while all other variables are held at zero. The right chart examines the behavior as the second variable (`x₂`) changes while all others are held at zero. Each chart compares a learned function ("LPN 2") against a reference function (the L1 norm).
### Components/Axes
**Titles:**
* Left Chart: `Cross sections of J(x₁, 0, ...) Dim 8`
* Right Chart: `Cross sections of J(0, x₂, 0, ...) Dim 8`
**Y-Axis (Both Charts):**
* Label: `Priorfunctions(x₁, 0, ...)` (left) / `Priorfunctions(0, x₂, 0, ...)` (right)
* Scale: Linear, ranging from 0.0 to 4.0, with major ticks at 0.5 intervals.
**X-Axis (Left Chart):**
* Label: `x₁`
* Scale: Linear, ranging from -4 to 4, with major ticks at integer intervals.
**X-Axis (Right Chart):**
* Label: `x₂`
* Scale: Linear, ranging from -4 to 4, with major ticks at integer intervals.
**Legend (Both Charts, positioned in the bottom-left corner):**
* `LPN 2`: Represented by a solid blue line.
* `Ref J(x) = ||x||₁`: Represented by a dashed orange line. This is the L1 norm (sum of absolute values).
### Detailed Analysis
Both charts display a symmetric, V-shaped curve centered at x=0. The reference function (dashed orange) is a perfect V, reaching a minimum value of 0.0 at x=0 and increasing linearly to 4.0 at x=±4.
The "LPN 2" function (solid blue) closely follows the reference but exhibits a key difference: its minimum at x=0 is not zero. It is a smooth, rounded approximation of the L1 norm.
**Approximate Data Points for "LPN 2" (Blue Line):**
* **At x = -4:** y ≈ 3.75
* **At x = -2:** y ≈ 1.9
* **At x = 0:** y ≈ 0.25 (This is the minimum, notably above 0.0)
* **At x = 2:** y ≈ 1.9
* **At x = 4:** y ≈ 3.75
**Visual Trend Verification:**
* **LPN 2 (Blue):** The line slopes downward from left to center, reaching a smooth minimum at x=0, then slopes upward symmetrically to the right. The curve is slightly above the reference line everywhere except at the extreme points (x=±4), where they converge.
* **Ref J(x) (Orange):** The line slopes downward linearly from left to center, hits a sharp point (cusp) at x=0, then slopes upward linearly to the right.
### Key Observations
1. **Symmetry:** Both functions are perfectly symmetric around x=0 in their respective dimensions.
2. **Minimum Value Discrepancy:** The most significant difference is at the origin. The reference L1 norm has a sharp, non-differentiable minimum at 0.0. The "LPN 2" function has a smooth, differentiable minimum at approximately 0.25.
3. **Convergence at Extremes:** The two functions converge in value at the boundaries of the plotted range (x=±4).
4. **Identical Behavior Across Dimensions:** The plots for `x₁` and `x₂` are visually identical, suggesting the "LPN 2" function treats these dimensions equivalently in this cross-sectional view.
### Interpretation
This visualization demonstrates a learned function ("LPN 2") that approximates the L1 norm (`||x||₁`). The L1 norm is commonly used in machine learning and statistics for regularization (e.g., Lasso regression) and as a loss function, but its non-differentiability at zero can be problematic for gradient-based optimization methods.
The "LPN 2" function appears to be a **smooth, differentiable approximation** of the L1 norm. The key evidence is the rounded minimum at x=0 (y≈0.25) instead of a sharp cusp at y=0.0. This property makes it suitable for use in contexts where gradients are required, while still promoting sparsity (a key characteristic of L1-based methods) due to its overall V-shape. The fact that the approximation is slightly above the true L1 norm everywhere else is a typical trade-off for achieving differentiability. The identical plots for `x₁` and `x₂` indicate the approximation is consistent across at least the first two dimensions of the 8-dimensional space.