## Grid World Diagram
### Overview
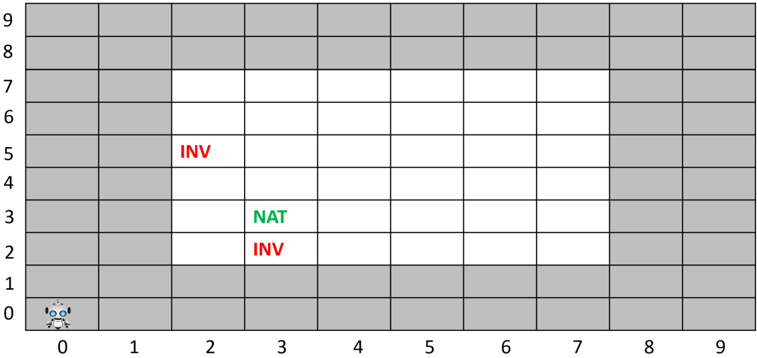
The image depicts a 10x10 grid world environment. Some cells are grayed out, representing obstacles or boundaries, while others are white, indicating traversable space. A small robot icon is located in the bottom-left corner (0,0). The grid also contains labels "INV" (in red) and "NAT" (in green) at specific locations.
### Components/Axes
* **Grid:** 10x10 grid, with rows and columns numbered 0-9.
* **Robot:** A small robot icon located at grid coordinate (0,0).
* **Obstacles/Boundaries:** Grayed-out cells representing impassable areas.
* **Labels:**
* "INV" (red) at (2,5)
* "NAT" (green) at (3,3)
* "INV" (red) at (3,2)
### Detailed Analysis or ### Content Details
The grid world has the following characteristics:
* **Dimensions:** 10 rows and 10 columns, indexed from 0 to 9.
* **Robot Starting Position:** The robot is located at the bottom-left corner, coordinate (0,0).
* **Obstacle Configuration:**
* Row 0 (y=0) is entirely grayed out.
* Row 1 (y=1) is grayed out except for columns 0, 1, 2, and 3.
* Rows 2, 3, 4, 5, 6, and 7 are grayed out for columns 0, 1, 8, and 9.
* Rows 8 and 9 are entirely grayed out.
* **Labeled Cells:**
* Cell (2,5) contains the label "INV" in red.
* Cell (3,3) contains the label "NAT" in green.
* Cell (3,2) contains the label "INV" in red.
### Key Observations
* The robot starts in a corner surrounded by obstacles.
* The "NAT" and "INV" labels are clustered together in the middle-left area of the traversable space.
* The traversable space forms a roughly rectangular area in the center of the grid.
### Interpretation
This grid world likely represents a simplified environment for a robot navigation or pathfinding problem. The grayed-out cells define the boundaries and obstacles that the robot must avoid. The "NAT" and "INV" labels could represent different types of locations or objects within the environment, potentially indicating natural resources ("NAT") and areas to investigate ("INV"). The robot's task might be to navigate to these locations while avoiding obstacles. The clustering of "NAT" and "INV" suggests a possible relationship or interaction between these elements within the problem context.