\n
## Grid Diagram: State Transitions
### Overview
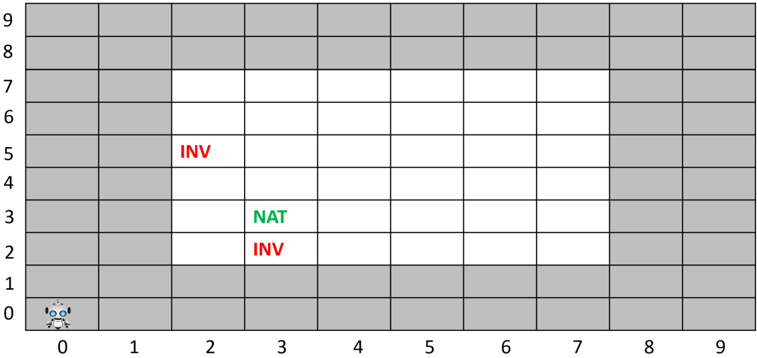
The image presents a grid-based diagram representing state transitions, likely within a system or process. The grid spans from x=0 to x=9 and y=0 to y=9. Several cells within the grid are labeled with the abbreviations "INV" and "NAT". The grid cells are colored either gray or white, with the labeled cells being white. A small icon is present at the bottom-left corner (x=0, y=0).
### Components/Axes
* **X-axis:** Ranges from 0 to 9, with integer markings.
* **Y-axis:** Ranges from 0 to 9, with integer markings.
* **Labels:** "INV" (appears three times), "NAT" (appears once).
* **Icon:** A small, colorful icon is located at the coordinates (0,0).
* **Grid Cells:** The grid is composed of 10x10 cells, colored either gray or white.
### Detailed Analysis or Content Details
The labeled cells are positioned as follows:
* **INV:** Located at approximately (1, 5), (3, 2), and (4, 1).
* **NAT:** Located at approximately (3, 3).
The white cells containing the labels are surrounded by gray cells. The icon at (0,0) appears to be a cartoon-style representation of a robot or character.
### Key Observations
The labels "INV" and "NAT" appear to represent different states or conditions within the system. The arrangement of these labels within the grid suggests a possible sequence or relationship between these states. The icon at (0,0) might represent the initial state or an agent interacting with the system. The grid structure implies a discrete state space.
### Interpretation
The diagram likely represents a state transition diagram or a similar visualization of a system's behavior. "INV" and "NAT" could stand for "Invalid" and "Natural" (or other similar concepts), representing different states the system can occupy. The grid's coordinates could represent time steps or other relevant parameters. The presence of the icon suggests an agent or process that moves between these states.
The limited data makes it difficult to draw definitive conclusions. However, the diagram suggests a system where transitions between "INV" and "NAT" states occur, and the grid structure provides a framework for analyzing these transitions. Further context would be needed to understand the specific meaning of the labels and the overall purpose of the diagram.