# Technical Document Extraction: AUROC Performance by Representation Type
## 1. Image Classification and Overview
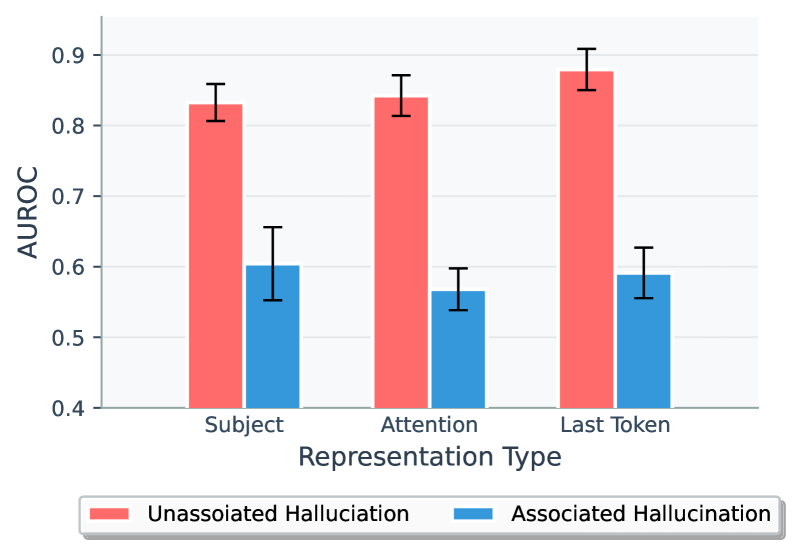
This image is a **grouped bar chart** comparing the performance (measured in AUROC) of two different hallucination categories across three distinct representation types. The chart includes error bars representing variability or confidence intervals for each data point.
## 2. Component Isolation
### A. Header / Axis Labels
* **Y-Axis Title:** `AUROC` (Area Under the Receiver Operating Characteristic curve).
* **X-Axis Title:** `Representation Type`.
* **Y-Axis Scale:** Numerical values ranging from `0.4` to `0.9` with major gridline increments of `0.1`.
* **X-Axis Categories:** `Subject`, `Attention`, `Last Token`.
### B. Legend (Spatial Grounding: Bottom Center)
The legend is located in a boxed area at the bottom of the chart.
* **Red Bar (Left):** `Unassoiated Halluciation` [sic] (Note: The image contains a typo for "Unassociated Hallucination").
* **Blue Bar (Right):** `Associated Hallucination`.
### C. Main Chart Area
The chart consists of three pairs of bars. In every pair, the red bar is significantly higher than the blue bar.
---
## 3. Data Extraction and Trend Verification
### Trend Analysis
* **Unassociated Hallucination (Red):** Shows a consistent **upward trend** across the categories. Performance is high at "Subject," slightly higher at "Attention," and reaches its peak at "Last Token."
* **Associated Hallucination (Blue):** Shows a **fluctuating/downward trend**. Performance starts at its highest in "Subject," drops to its lowest in "Attention," and recovers slightly in "Last Token," though it remains lower than the initial "Subject" value.
* **Comparative Gap:** The performance gap between "Unassociated" and "Associated" hallucinations increases as we move from left to right across the X-axis.
### Reconstructed Data Table
Values are estimated based on the Y-axis scale and gridlines.
| Representation Type | Unassociated Hallucination (Red) | Associated Hallucination (Blue) |
| :--- | :--- | :--- |
| **Subject** | ~0.83 (Error: ±0.03) | ~0.60 (Error: ±0.05) |
| **Attention** | ~0.84 (Error: ±0.03) | ~0.57 (Error: ±0.03) |
| **Last Token** | ~0.88 (Error: ±0.03) | ~0.59 (Error: ±0.04) |
---
## 4. Detailed Component Description
* **Subject Representation:**
* The Red bar (Unassociated) sits between 0.8 and 0.9, centered at approximately 0.83.
* The Blue bar (Associated) sits exactly on the 0.6 gridline.
* **Attention Representation:**
* The Red bar (Unassociated) shows a marginal increase compared to Subject, sitting at approximately 0.84.
* The Blue bar (Associated) shows a decrease, sitting below the 0.6 line at approximately 0.57.
* **Last Token Representation:**
* The Red bar (Unassociated) shows the highest performance in the set, approaching the 0.9 mark (approx. 0.88).
* The Blue bar (Associated) shows a slight recovery from the Attention phase but remains below the 0.6 mark (approx. 0.59).
## 5. Explicit Language Declaration
* **Primary Language:** English.
* **Note on Transcription:** The legend contains a typographical error: "Unassoiated Halluciation". This has been transcribed exactly as it appears in the image for technical accuracy. The intended meaning is "Unassociated Hallucination."