\n
## Bar Chart: AUROC Scores for Hallucination Types
### Overview
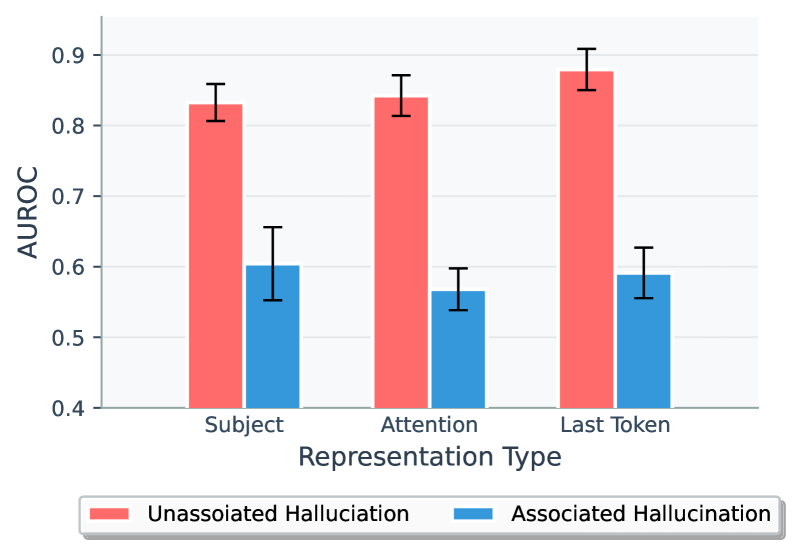
This bar chart compares the Area Under the Receiver Operating Characteristic curve (AUROC) scores for two types of hallucinations – "Unassociated Hallucination" and "Associated Hallucination" – across three different "Representation Types": "Subject", "Attention", and "Last Token". Error bars are included for each data point, indicating the variability or confidence interval around the mean AUROC score.
### Components/Axes
* **X-axis:** "Representation Type" with categories: "Subject", "Attention", "Last Token".
* **Y-axis:** "AUROC" with a scale ranging from approximately 0.4 to 0.9.
* **Legend:** Located at the bottom-left of the chart.
* "Unassociated Hallucination" – represented by a red color.
* "Associated Hallucination" – represented by a blue color.
### Detailed Analysis
The chart consists of six bars, grouped by Representation Type. Each group contains one red bar (Unassociated Hallucination) and one blue bar (Associated Hallucination). Error bars are present on top of each bar.
* **Subject:**
* Unassociated Hallucination: The red bar is approximately 0.82 ± 0.03 (estimated from the error bar length). The bar slopes upward.
* Associated Hallucination: The blue bar is approximately 0.62 ± 0.05. The bar slopes upward.
* **Attention:**
* Unassociated Hallucination: The red bar is approximately 0.84 ± 0.04. The bar slopes upward.
* Associated Hallucination: The blue bar is approximately 0.56 ± 0.04. The bar slopes upward.
* **Last Token:**
* Unassociated Hallucination: The red bar is approximately 0.87 ± 0.03. The bar slopes upward.
* Associated Hallucination: The blue bar is approximately 0.60 ± 0.04. The bar slopes upward.
### Key Observations
* For all three Representation Types, the AUROC score is consistently higher for "Unassociated Hallucination" than for "Associated Hallucination".
* The AUROC scores for "Unassociated Hallucination" generally increase slightly as the Representation Type changes from "Subject" to "Attention" to "Last Token".
* The error bars suggest that the differences between the two hallucination types are statistically significant for each Representation Type.
### Interpretation
The data suggests that it is easier to detect "Unassociated Hallucinations" than "Associated Hallucinations" across all three representation types. The increasing AUROC scores for "Unassociated Hallucinations" as the representation moves from "Subject" to "Last Token" could indicate that the later stages of the model's processing are more prone to generating unassociated hallucinations, or that these hallucinations are easier to identify in the later stages. The consistent gap between the two hallucination types suggests a fundamental difference in how these hallucinations manifest within the model's representations. The error bars provide a measure of confidence in these observations, indicating that the observed differences are likely not due to random chance. This information is valuable for understanding and mitigating hallucination issues in language models.