## Comparative Performance Chart: Model Size vs. Grid Accuracy
### Overview
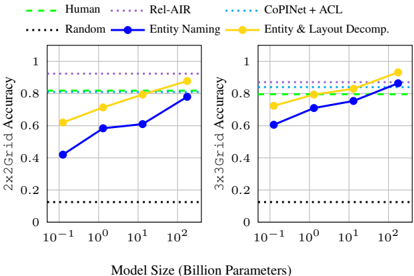
The image displays two side-by-side line charts comparing the performance of different models and baselines on two tasks: "2x2 Grid Accuracy" and "3x3 Grid Accuracy." The performance is plotted against model size (in billion parameters) on a logarithmic scale. The charts aim to show how accuracy scales with model capacity for different methods.
### Components/Axes
* **Chart Type:** Two line charts with markers.
* **Titles:**
* Left Chart Y-axis: `2x2 Grid Accuracy`
* Right Chart Y-axis: `3x3 Grid Accuracy`
* Shared X-axis (bottom): `Model Size (Billion Parameters)`
* **Axes:**
* **X-axis (both charts):** Logarithmic scale. Major tick marks at `10^-1` (0.1), `10^0` (1), `10^1` (10), and `10^2` (100) billion parameters.
* **Y-axis (both charts):** Linear scale from 0 to 1, with major ticks at 0, 0.2, 0.4, 0.6, 0.8, and 1.0.
* **Legend (Top of image, spanning both charts):**
* `Human` (Green dashed line)
* `Rel-AIR` (Purple dotted line)
* `CoINet + ACL` (Blue dotted line)
* `Random` (Black dotted line)
* `Entity Naming` (Blue solid line with circle markers)
* `Entity & Layout Decomp.` (Yellow solid line with circle markers)
### Detailed Analysis
**Left Chart: 2x2 Grid Accuracy**
* **Baselines (Horizontal Lines):**
* `Human`: Constant at ~0.80.
* `Rel-AIR`: Constant at ~0.90.
* `CoINet + ACL`: Constant at ~0.85.
* `Random`: Constant at ~0.10.
* **Scaling Methods (Lines with upward trend):**
* `Entity Naming` (Blue line): Starts at ~0.40 (0.1B params), rises to ~0.60 (1B), ~0.62 (10B), and ends at ~0.80 (100B). Trend: Steady upward slope, approaching Human-level performance at the largest size.
* `Entity & Layout Decomp.` (Yellow line): Starts at ~0.60 (0.1B), rises to ~0.70 (1B), ~0.80 (10B), and ends at ~0.90 (100B). Trend: Consistently upward slope, surpassing Human and CoINet+ACL baselines, and matching Rel-AIR at the largest size.
**Right Chart: 3x3 Grid Accuracy**
* **Baselines (Horizontal Lines):**
* `Human`: Constant at ~0.80.
* `Rel-AIR`: Constant at ~0.90.
* `CoINet + ACL`: Constant at ~0.85.
* `Random`: Constant at ~0.10.
* **Scaling Methods (Lines with upward trend):**
* `Entity Naming` (Blue line): Starts at ~0.60 (0.1B), rises to ~0.70 (1B), ~0.75 (10B), and ends at ~0.80 (100B). Trend: Upward slope, converging with the Human baseline at the largest size.
* `Entity & Layout Decomp.` (Yellow line): Starts at ~0.70 (0.1B), rises to ~0.80 (1B), ~0.85 (10B), and ends at ~0.95 (100B). Trend: Strong upward slope, surpassing all baselines including Rel-AIR at the largest model size.
### Key Observations
1. **Performance Hierarchy:** For both tasks, the `Entity & Layout Decomp.` method consistently outperforms the `Entity Naming` method at every model size.
2. **Scaling Benefit:** Both `Entity Naming` and `Entity & Layout Decomp.` show clear positive scaling with model size. Their accuracy improves as the number of parameters increases from 0.1B to 100B.
3. **Baseline Comparison:** The baseline methods (`Human`, `Rel-AIR`, `CoINet + ACL`, `Random`) are depicted as flat lines, indicating their performance is treated as a fixed reference point independent of the model size being evaluated.
4. **Task Difficulty:** The starting performance (at 0.1B parameters) for both scaling methods is lower on the 2x2 task than on the 3x3 task, suggesting the 2x2 grid task may be initially more challenging for these models at small scale.
5. **Convergence:** At the largest model size (100B), `Entity & Layout Decomp.` matches or exceeds the strongest baseline (`Rel-AIR`) on both tasks. `Entity Naming` converges to the `Human` baseline on both tasks.
### Interpretation
This visualization demonstrates the principle of **scaling laws** for specific AI model architectures on structured reasoning tasks (grid accuracy). The key insight is that methods incorporating explicit structural decomposition (`Entity & Layout Decomp.`) not only start with a higher performance floor but also exhibit a steeper and more sustained improvement with scale compared to a simpler method (`Entity Naming`).
The data suggests that for complex spatial or layout-based reasoning, the architectural choice of how a model represents entities and their relationships is critical. The `Entity & Layout Decomp.` method's superior scaling indicates it is more effectively utilizing increased model capacity to learn the underlying task structure. The fact that it surpasses strong, specialized baselines (`Rel-AIR`, `CoINet+ACL`) at 100B parameters implies that large-scale models with appropriate inductive biases can achieve super-human or state-of-the-art performance on these benchmarks.
The consistent gap between the two scaling methods across both tasks highlights that the advantage of layout decomposition is robust and not specific to a single grid size. The charts argue for investing in model architectures with built-in structural priors when targeting tasks with inherent spatial or relational logic.