## Chart: Number of MC steps vs. Dimension
### Overview
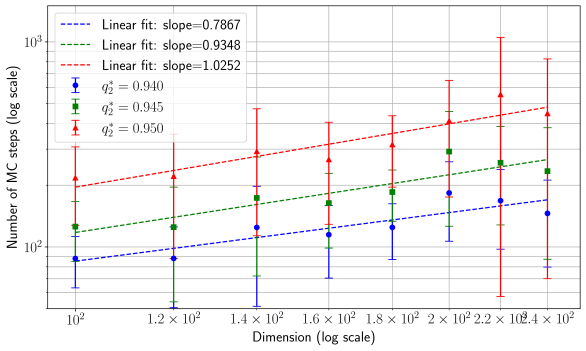
The image is a scatter plot with error bars, showing the relationship between the number of Monte Carlo (MC) steps (log scale) and dimension (log scale) for three different values of a parameter denoted as q₂*. Each data series is also accompanied by a linear fit line.
### Components/Axes
* **X-axis:** Dimension (log scale). The x-axis ranges from approximately 10² to 2.4 x 10². Markers are present at 10², 1.2 x 10², 1.4 x 10², 1.6 x 10², 1.8 x 10², 2 x 10², 2.2 x 10², and 2.4 x 10².
* **Y-axis:** Number of MC steps (log scale). The y-axis ranges from approximately 10² to 10³.
* **Legend (top-left):**
* Blue dashed line: Linear fit; slope = 0.7867
* Green dashed line: Linear fit; slope = 0.9348
* Red dashed line: Linear fit; slope = 1.0252
* Blue circles with error bars: q₂* = 0.940
* Green squares with error bars: q₂* = 0.945
* Red triangles with error bars: q₂* = 0.950
### Detailed Analysis
* **Data Series 1 (q₂* = 0.940, blue circles):**
* Trend: The number of MC steps increases as the dimension increases.
* Data points (approximate):
* (10², ~85)
* (1.2 x 10², ~90)
* (1.4 x 10², ~100)
* (1.6 x 10², ~110)
* (1.8 x 10², ~115)
* (2 x 10², ~120)
* (2.2 x 10², ~130)
* (2.4 x 10², ~140)
* **Data Series 2 (q₂* = 0.945, green squares):**
* Trend: The number of MC steps increases as the dimension increases.
* Data points (approximate):
* (10², ~105)
* (1.2 x 10², ~115)
* (1.4 x 10², ~130)
* (1.6 x 10², ~140)
* (1.8 x 10², ~150)
* (2 x 10², ~160)
* (2.2 x 10², ~170)
* (2.4 x 10², ~180)
* **Data Series 3 (q₂* = 0.950, red triangles):**
* Trend: The number of MC steps increases as the dimension increases.
* Data points (approximate):
* (10², ~115)
* (1.2 x 10², ~135)
* (1.4 x 10², ~150)
* (1.6 x 10², ~170)
* (1.8 x 10², ~180)
* (2 x 10², ~200)
* (2.2 x 10², ~220)
* (2.4 x 10², ~240)
* **Linear Fits:** The linear fits for each data series are shown as dashed lines. The slopes are provided in the legend. The red line has the steepest slope, followed by the green, and then the blue line.
### Key Observations
* For all three values of q₂*, the number of MC steps increases with dimension.
* The rate of increase (slope of the linear fit) is highest for q₂* = 0.950 and lowest for q₂* = 0.940.
* The error bars appear to increase in magnitude as the dimension increases.
### Interpretation
The plot suggests that as the dimension increases, the number of Monte Carlo steps required to achieve a certain level of accuracy or convergence also increases. Furthermore, the parameter q₂* influences the rate at which the number of MC steps increases with dimension. Higher values of q₂* lead to a more rapid increase in the number of MC steps. The increasing error bars with dimension suggest that the variance in the number of MC steps also increases with dimension, potentially indicating greater uncertainty or variability in the results.