## Chart: Monte Carlo Steps vs. Dimension
### Overview
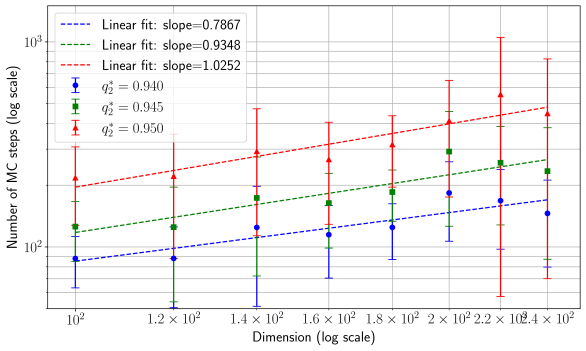
The image presents a scatter plot with error bars illustrating the relationship between the number of Monte Carlo (MC) steps required and the dimension of the problem. Three different curves are plotted, each representing a different value of *q*<sup>2</sup>, with linear fits overlaid. Both axes are on a logarithmic scale.
### Components/Axes
* **X-axis:** Dimension (log scale). Markers are at approximately 10<sup>2</sup>, 1.2 x 10<sup>2</sup>, 1.4 x 10<sup>2</sup>, 1.6 x 10<sup>2</sup>, 1.8 x 10<sup>2</sup>, 2 x 10<sup>2</sup>, 2.2 x 10<sup>2</sup>, and 2.4 x 10<sup>2</sup>.
* **Y-axis:** Number of MC steps (log scale). Markers are at approximately 10<sup>2</sup>, 10<sup>3</sup>.
* **Legend (top-right):**
* Blue dotted line: "Linear fit: slope=0.7867"
* Green dashed line: "Linear fit: slope=0.9348"
* Red dashed-dotted line: "Linear fit: slope=1.0252"
* Blue circles: q<sup>2</sup> = 0.940
* Green squares: q<sup>2</sup> = 0.945
* Red triangles: q<sup>2</sup> = 0.950
* **Error Bars:** Vertical error bars are present for each data point, indicating the uncertainty in the number of MC steps.
### Detailed Analysis
* **Blue Data Series (q<sup>2</sup> = 0.940):** The blue data points, represented by circles, show an upward trend. The line slopes upward with increasing dimension.
* (10<sup>2</sup>, ~90): Error bar extends from ~70 to ~110.
* (1.2 x 10<sup>2</sup>, ~120): Error bar extends from ~90 to ~150.
* (1.4 x 10<sup>2</sup>, ~150): Error bar extends from ~120 to ~180.
* (1.6 x 10<sup>2</sup>, ~180): Error bar extends from ~150 to ~210.
* (1.8 x 10<sup>2</sup>, ~210): Error bar extends from ~180 to ~240.
* (2 x 10<sup>2</sup>, ~240): Error bar extends from ~210 to ~270.
* (2.2 x 10<sup>2</sup>, ~270): Error bar extends from ~240 to ~300.
* (2.4 x 10<sup>2</sup>, ~300): Error bar extends from ~270 to ~330.
* **Green Data Series (q<sup>2</sup> = 0.945):** The green data points, represented by squares, also show an upward trend, steeper than the blue series.
* (10<sup>2</sup>, ~140): Error bar extends from ~110 to ~170.
* (1.2 x 10<sup>2</sup>, ~200): Error bar extends from ~160 to ~240.
* (1.4 x 10<sup>2</sup>, ~260): Error bar extends from ~220 to ~300.
* (1.6 x 10<sup>2</sup>, ~320): Error bar extends from ~280 to ~360.
* (1.8 x 10<sup>2</sup>, ~380): Error bar extends from ~340 to ~420.
* (2 x 10<sup>2</sup>, ~440): Error bar extends from ~400 to ~480.
* (2.2 x 10<sup>2</sup>, ~500): Error bar extends from ~460 to ~540.
* (2.4 x 10<sup>2</sup>, ~560): Error bar extends from ~520 to ~600.
* **Red Data Series (q<sup>2</sup> = 0.950):** The red data points, represented by triangles, exhibit the steepest upward trend.
* (10<sup>2</sup>, ~200): Error bar extends from ~150 to ~250.
* (1.2 x 10<sup>2</sup>, ~280): Error bar extends from ~220 to ~340.
* (1.4 x 10<sup>2</sup>, ~360): Error bar extends from ~300 to ~420.
* (1.6 x 10<sup>2</sup>, ~440): Error bar extends from ~380 to ~500.
* (1.8 x 10<sup>2</sup>, ~520): Error bar extends from ~460 to ~580.
* (2 x 10<sup>2</sup>, ~600): Error bar extends from ~540 to ~660.
* (2.2 x 10<sup>2</sup>, ~680): Error bar extends from ~620 to ~740.
* (2.4 x 10<sup>2</sup>, ~760): Error bar extends from ~700 to ~820.
### Key Observations
* The number of MC steps required increases with dimension for all values of *q*<sup>2</sup>.
* Higher values of *q*<sup>2</sup> require significantly more MC steps for a given dimension.
* The linear fits confirm the approximately linear relationship between the log of the number of MC steps and the log of the dimension.
* The error bars indicate substantial uncertainty in the number of MC steps, particularly at lower dimensions.
### Interpretation
The chart demonstrates the "curse of dimensionality" in the context of Monte Carlo simulations. As the dimensionality of the problem increases, the number of MC steps needed to achieve a certain level of accuracy grows rapidly. The parameter *q*<sup>2</sup> likely represents a quality factor or a measure of the problem's difficulty. Higher *q*<sup>2</sup> values indicate a more challenging problem, requiring more computational effort (MC steps) to explore the solution space effectively. The linear fits suggest that the scaling of MC steps with dimension is approximately exponential (since the slope of a log-log plot corresponds to the exponent). The error bars highlight the inherent stochasticity of Monte Carlo methods and the need for careful statistical analysis to ensure reliable results. The data suggests that for a fixed level of accuracy, the computational cost of Monte Carlo simulations increases dramatically with increasing dimensionality, especially for problems with higher *q*<sup>2</sup> values.