## Line Graph: Scaling of Monte Carlo Steps with Dimension
### Overview
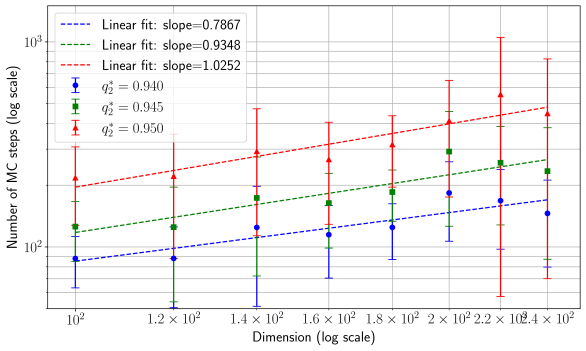
The image is a log-log line graph comparing the number of Monte Carlo (MC) steps required across different dimensions (x-axis) for three distinct parameter values of *q₂* (0.940, 0.945, 0.950). Three linear fits are overlaid, each with a unique slope, and data points with error bars are plotted for each *q₂* value.
### Components/Axes
- **X-axis**: "Dimension (log scale)" ranging from 10² to 2.4×10² in logarithmic increments (10², 1.2×10², 1.4×10², ..., 2.4×10²).
- **Y-axis**: "Number of MC steps (log scale)" ranging from 10² to 10³ in logarithmic increments.
- **Legend**: Located in the top-left corner, with three entries:
- Blue dashed line: Slope = 0.7867 (q₂ = 0.940).
- Green dash-dot line: Slope = 0.9348 (q₂ = 0.945).
- Red dashed line: Slope = 1.0252 (q₂ = 0.950).
- **Data Points**: Vertical error bars are plotted for each *q₂* value at every dimension.
### Detailed Analysis
1. **Blue Line (q₂ = 0.940)**:
- Slope: 0.7867 (shallowest).
- Data points: Start at ~10² MC steps for 10² dimension, increasing to ~2×10² MC steps for 2.4×10² dimension.
- Error bars: Smallest uncertainty (~±10–20% of the data point value).
2. **Green Line (q₂ = 0.945)**:
- Slope: 0.9348 (moderate).
- Data points: Start at ~10² MC steps for 10² dimension, increasing to ~3×10² MC steps for 2.4×10² dimension.
- Error bars: Moderate uncertainty (~±20–30%).
3. **Red Line (q₂ = 0.950)**:
- Slope: 1.0252 (steepest).
- Data points: Start at ~10² MC steps for 10² dimension, increasing to ~5×10² MC steps for 2.4×10² dimension.
- Error bars: Largest uncertainty (~±30–50%).
### Key Observations
- All three lines exhibit upward trends, indicating that the number of MC steps increases with dimension.
- The red line (q₂ = 0.950) has the steepest slope, suggesting the highest computational cost at larger dimensions.
- Error bars grow larger for higher *q₂* values, reflecting increased variability in MC steps at higher dimensions.
- The slopes confirm a power-law relationship: MC steps ∝ dimension^slope.
### Interpretation
The data demonstrates that higher *q₂* values correlate with steeper scaling of MC steps with dimension. For example:
- At *q₂* = 0.940, the system scales sublinearly (slope < 1).
- At *q₂* = 0.950, the system scales superlinearly (slope > 1), implying exponential growth in computational effort as dimension increases.
- The error bars suggest that uncertainty in MC steps grows with both *q₂* and dimension, highlighting the need for robust error handling in high-dimensional simulations.
This trend underscores the trade-off between parameter precision (*q₂*) and computational feasibility in Monte Carlo methods. Systems with higher *q₂* may require specialized optimization strategies to manage scaling costs.