## Cumulative Distribution Function (CDF) Chart: E2E Latency Comparison
### Overview
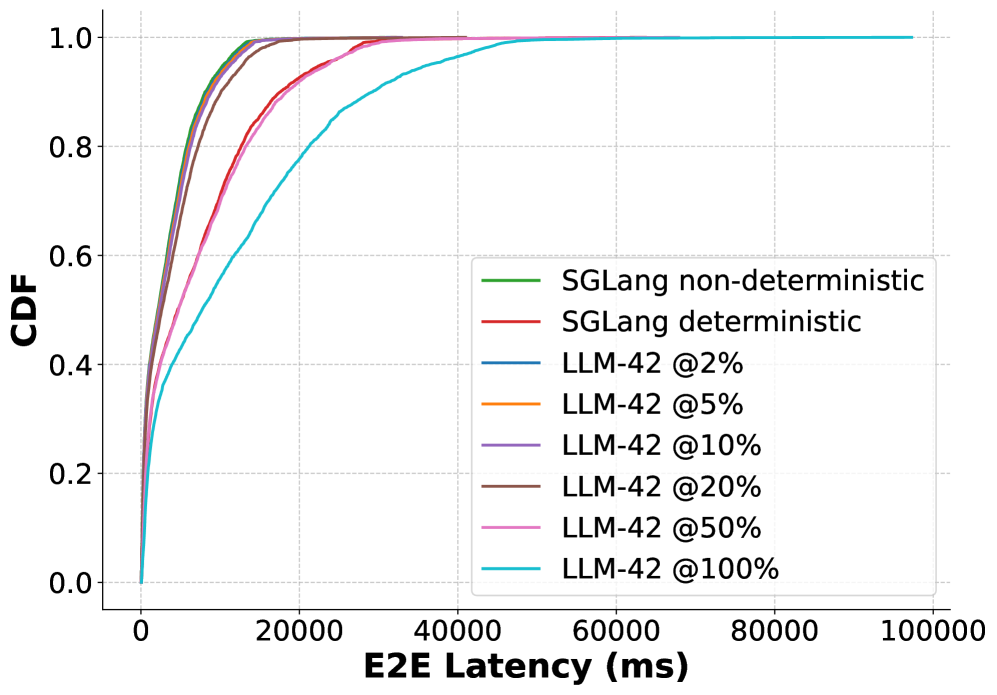
The image is a cumulative distribution function (CDF) chart comparing the end-to-end (E2E) latency of different systems: SGLang (non-deterministic and deterministic) and LLM-42 at various percentages (2%, 5%, 10%, 20%, 50%, and 100%). The chart displays the cumulative probability of the E2E latency on the y-axis against the E2E latency in milliseconds (ms) on the x-axis.
### Components/Axes
* **X-axis:** E2E Latency (ms). Scale ranges from 0 to 100000 ms, with tick marks at intervals of 20000 ms.
* **Y-axis:** CDF. Scale ranges from 0.0 to 1.0, with tick marks at intervals of 0.2.
* **Legend:** Located on the right side of the chart, listing the different systems and their corresponding colors:
* SGLang non-deterministic (Green)
* SGLang deterministic (Red)
* LLM-42 @2% (Dark Blue)
* LLM-42 @5% (Orange)
* LLM-42 @10% (Purple)
* LLM-42 @20% (Brown)
* LLM-42 @50% (Pink)
* LLM-42 @100% (Light Blue)
### Detailed Analysis
* **SGLang non-deterministic (Green):** The line rises sharply from 0 to 1 CDF between 0 and approximately 10000 ms.
* **SGLang deterministic (Red):** The line rises sharply from 0 to 1 CDF between 0 and approximately 15000 ms.
* **LLM-42 @2% (Dark Blue):** The line rises sharply from 0 to 1 CDF between 0 and approximately 12000 ms.
* **LLM-42 @5% (Orange):** The line rises sharply from 0 to 1 CDF between 0 and approximately 13000 ms.
* **LLM-42 @10% (Purple):** The line rises sharply from 0 to 1 CDF between 0 and approximately 14000 ms.
* **LLM-42 @20% (Brown):** The line rises sharply from 0 to 1 CDF between 0 and approximately 15000 ms.
* **LLM-42 @50% (Pink):** The line rises sharply from 0 to 1 CDF between 0 and approximately 17000 ms.
* **LLM-42 @100% (Light Blue):** The line rises gradually from 0 to 1 CDF between 0 and approximately 60000 ms.
### Key Observations
* SGLang non-deterministic has the lowest latency, reaching a CDF of 1 at approximately 10000 ms.
* SGLang deterministic, LLM-42 @2%, LLM-42 @5%, LLM-42 @10%, and LLM-42 @20% have similar latency profiles, reaching a CDF of 1 between 12000 and 15000 ms.
* LLM-42 @50% has a slightly higher latency, reaching a CDF of 1 at approximately 17000 ms.
* LLM-42 @100% has the highest latency, reaching a CDF of 1 at approximately 60000 ms.
### Interpretation
The CDF chart illustrates the distribution of E2E latency for different systems. The steeper the curve, the lower the latency. The data suggests that SGLang non-deterministic has the best latency performance, followed by SGLang deterministic and LLM-42 at lower percentages (2% to 20%). As the percentage of LLM-42 increases, the latency also increases, with LLM-42 @100% exhibiting significantly higher latency compared to the other systems. This indicates that increasing the percentage of LLM-42 has a negative impact on the E2E latency. The chart allows for a comparison of the probability of a given latency occurring for each system. For example, one can determine the probability that the latency will be less than 20000 ms for each system.