## CDF Plot: E2E Latency Comparison
### Overview
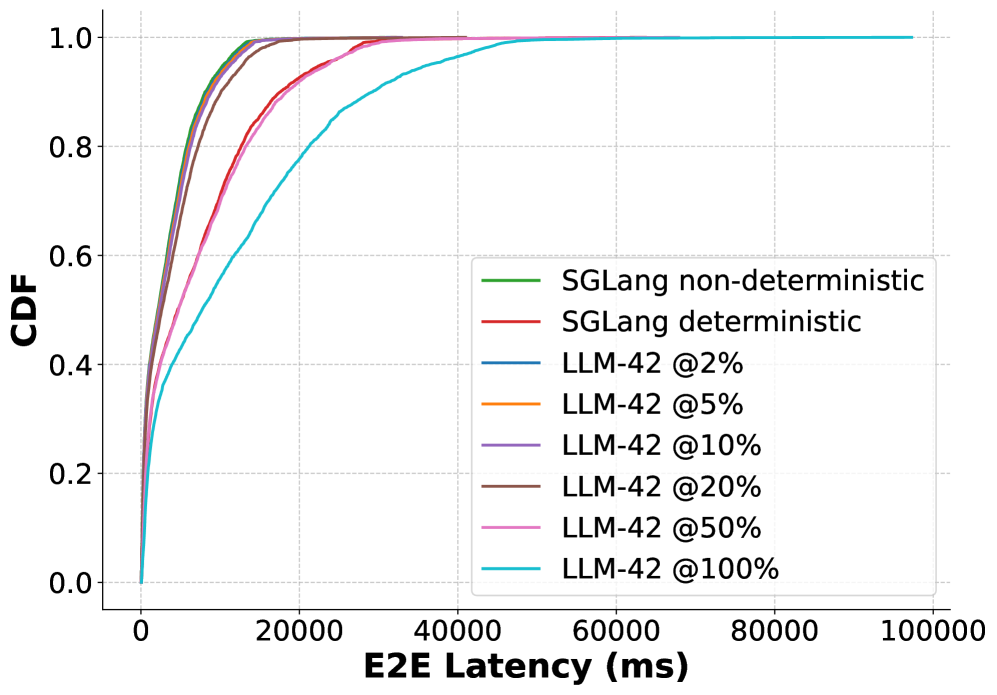
This image is a Cumulative Distribution Function (CDF) plot illustrating the End-to-End (E2E) latency performance of two different systems: SGLang (in deterministic and non-deterministic modes) and LLM-42 (configured at various percentage levels). The plot visualizes the probability distribution of latency values, where a steeper curve shifted to the left indicates lower latency (better performance).
### Components/Axes
* **X-Axis:** "E2E Latency (ms)". The scale is linear, ranging from 0 to 100,000 ms.
* **Y-Axis:** "CDF". The scale ranges from 0.0 to 1.0, representing the cumulative probability.
* **Legend:** Located in the center-right area of the chart. The legend maps colors to specific configurations:
* **Green:** SGLang non-deterministic
* **Red:** SGLang deterministic
* **Blue:** LLM-42 @2%
* **Orange:** LLM-42 @5%
* **Purple:** LLM-42 @10%
* **Brown:** LLM-42 @20%
* **Pink:** LLM-42 @50%
* **Cyan:** LLM-42 @100%
### Detailed Analysis
**Trend Verification:** All data series exhibit a positive slope starting from (0,0). The curves rise steeply initially and flatten out as they approach a CDF of 1.0. The further to the right a curve is, the higher the latency for that configuration.
* **High-Performance Cluster (Green, Red, Blue, Orange, Purple, Brown):**
* These six lines are tightly clustered on the far left of the chart.
* They exhibit the steepest slopes, reaching a CDF of 0.9 at approximately 10,000 ms to 15,000 ms.
* There is negligible performance difference between SGLang (both modes) and LLM-42 at low percentages (2%–20%).
* **Moderate-Performance (Pink - LLM-42 @50%):**
* This line is positioned to the right of the high-performance cluster.
* It reaches a CDF of 0.9 at approximately 25,000 ms, indicating a significant latency increase compared to the lower percentage configurations.
* **Low-Performance (Cyan - LLM-42 @100%):**
* This is the rightmost line, indicating the highest latency.
* It reaches a CDF of 0.9 at approximately 50,000 ms.
* The curve continues to rise gradually, reaching a CDF of 1.0 near 100,000 ms.
### Key Observations
* **Performance Scaling:** There is a clear, non-linear correlation between the LLM-42 percentage parameter and E2E latency. Increasing the percentage from 20% to 50% and then to 100% results in progressively larger latency penalties.
* **SGLang Efficiency:** SGLang (both deterministic and non-deterministic) performs consistently well, matching the latency profile of the most restrictive LLM-42 settings (2%–20%).
* **Clustering:** The performance gap between 2% and 20% LLM-42 is minimal, suggesting that within this range, the latency overhead is relatively stable.
### Interpretation
The data demonstrates that SGLang is a highly efficient system for minimizing E2E latency, performing on par with the most optimized (lowest percentage) settings of LLM-42.
Conversely, the LLM-42 system exhibits a significant "latency tax" as the percentage parameter increases. The jump in latency is particularly dramatic when moving from 50% to 100%. This suggests that for latency-sensitive applications, users should either utilize SGLang or strictly limit the LLM-42 percentage parameter to avoid the steep latency tail observed at 50% and 100%. The rightward shift of the curves as the percentage increases indicates that higher percentages not only increase the median latency but also significantly extend the "long tail" of latency (the 90th–99th percentile).