## CDF Plot: End-to-End Latency Comparison
### Overview
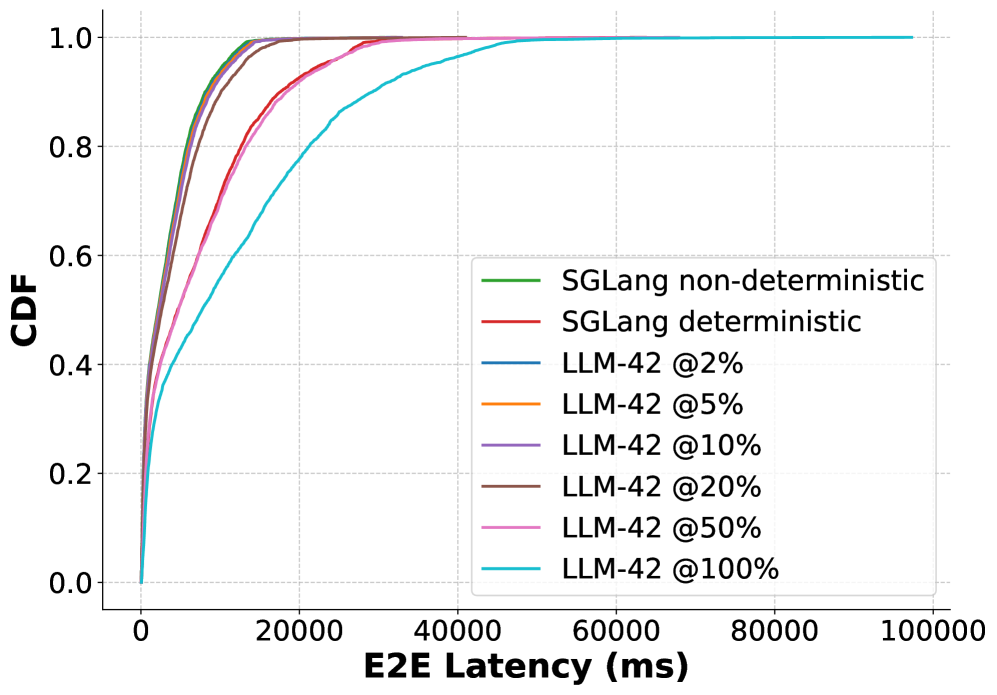
This image is a Cumulative Distribution Function (CDF) plot comparing the end-to-end (E2E) latency distributions of several systems or configurations. The chart visualizes the probability (CDF) that a request's latency is less than or equal to a given value on the x-axis. The primary comparison is between two variants of "SGLang" and multiple configurations of "LLM-42" at different percentage levels.
### Components/Axes
* **Chart Type:** Cumulative Distribution Function (CDF) line plot.
* **X-Axis:**
* **Label:** `E2E Latency (ms)`
* **Scale:** Linear scale from 0 to 100,000 milliseconds (ms).
* **Major Ticks:** 0, 20000, 40000, 60000, 80000, 100000.
* **Y-Axis:**
* **Label:** `CDF`
* **Scale:** Linear scale from 0.0 to 1.0.
* **Major Ticks:** 0.0, 0.2, 0.4, 0.6, 0.8, 1.0.
* **Legend:** Located in the bottom-right quadrant of the plot area. It contains 8 entries, each with a colored line sample and a text label.
1. **Green Line:** `SGLang non-deterministic`
2. **Red Line:** `SGLang deterministic`
3. **Blue Line:** `LLM-42 @2%`
4. **Orange Line:** `LLM-42 @5%`
5. **Purple Line:** `LLM-42 @10%`
6. **Brown Line:** `LLM-42 @20%`
7. **Pink Line:** `LLM-42 @50%`
8. **Cyan Line:** `LLM-42 @100%`
### Detailed Analysis
The plot shows eight distinct CDF curves. The general trend for all curves is a steep initial rise that gradually plateaus as they approach a CDF of 1.0. The key difference is the latency value at which this plateau occurs.
**Trend Verification & Data Points (Approximate):**
1. **SGLang non-deterministic (Green):**
* **Trend:** The steepest initial slope. Reaches a CDF of ~0.9 by ~10,000 ms and plateaus near 1.0 by ~15,000 ms.
* **Interpretation:** This configuration has the lowest latency profile, with nearly all requests completing under 15 seconds.
2. **SGLang deterministic (Red):**
* **Trend:** Very similar to the green line but slightly less steep. Reaches CDF ~0.9 by ~12,000 ms and plateaus by ~20,000 ms.
* **Interpretation:** Deterministic mode introduces a small latency overhead compared to non-deterministic mode.
3. **LLM-42 @2% (Blue), @5% (Orange), @10% (Purple), @20% (Brown):**
* **Trend:** These four lines are tightly clustered together, forming a distinct group between the SGLang lines and the higher-percentage LLM-42 lines. They rise steeply, reaching CDF ~0.8 by ~15,000 ms and plateauing near 1.0 by ~25,000-30,000 ms.
* **Interpretation:** At lower percentage loads (2%-20%), the LLM-42 system exhibits very similar latency performance, which is slower than SGLang but significantly faster than at higher percentages.
4. **LLM-42 @50% (Pink):**
* **Trend:** Clearly separated from the lower-percentage cluster. Has a less steep slope. Reaches CDF ~0.8 by ~20,000 ms and approaches 1.0 around ~40,000 ms.
* **Interpretation:** A noticeable performance degradation occurs at 50% load compared to 20%.
5. **LLM-42 @100% (Cyan):**
* **Trend:** The shallowest slope and rightmost curve. It rises more gradually, crossing CDF 0.8 at ~30,000 ms and only approaching 1.0 near the 60,000 ms mark.
* **Interpretation:** This represents the worst-case latency scenario shown, with a long tail of requests taking significantly longer to complete.
### Key Observations
* **Clear Performance Tiers:** The data reveals three distinct performance tiers:
1. **Fastest:** SGLang variants (both under ~20s).
2. **Mid-range:** LLM-42 at low load (2%-20%, under ~30s).
3. **Slowest:** LLM-42 at high load (50%-100%, with 100% extending to ~60s).
* **Non-Linear Degradation for LLM-42:** The latency increase for LLM-42 is not linear with the percentage. The jump from 20% to 50% is significant, and the jump from 50% to 100% is even more pronounced, indicating potential resource contention or queueing effects at higher loads.
* **SGLang Deterministic Overhead:** The deterministic version of SGLang shows a consistent, small latency penalty compared to its non-deterministic counterpart across the entire distribution.
* **Absence of Extreme Outliers:** All curves reach a CDF of 1.0 within the plotted range (100,000 ms), suggesting no requests in this dataset exceeded ~100 seconds.
### Interpretation
This CDF plot is a performance benchmark likely comparing a system named SGLang against another named LLM-42 under varying load conditions (represented by the percentages).
The data strongly suggests that **SGLang offers superior and more consistent latency performance** compared to LLM-42 in this test scenario. Its non-deterministic mode is the fastest overall.
For **LLM-42, the percentage likely represents a load factor** (e.g., GPU utilization, request rate, or batch size). The plot demonstrates a clear **performance cliff**: latency remains relatively stable and acceptable up to 20% load but degrades sharply at 50% and severely at 100%. This pattern is critical for capacity planning, indicating that operating LLM-42 beyond 20-50% of its capacity may lead to a poor user experience due to high and variable latency.
The use of a CDF is particularly effective here as it shows not just average latency, but the entire distribution, revealing the "tail latency" (the slowest requests) which is often the most important metric for user experience. The tight clustering of the low-load LLM-42 lines and the SGLang lines indicates predictable performance, while the spreading of the high-load lines indicates increasing variability and unpredictability under stress.