## CDF Chart: E2E Latency Distribution Comparison
### Overview
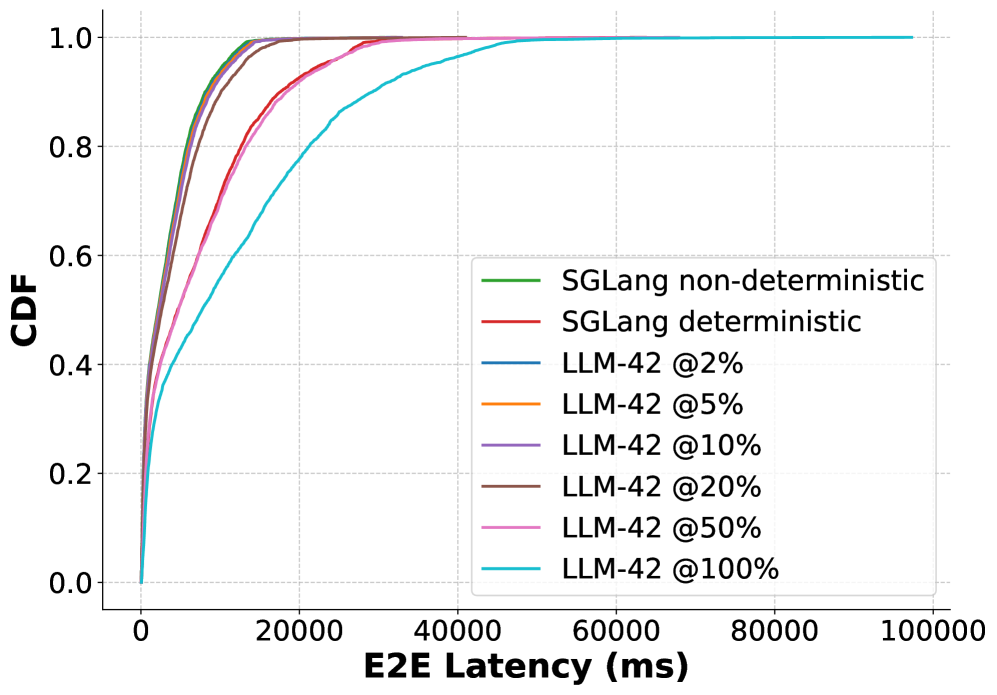
The chart compares the cumulative distribution function (CDF) of end-to-end (E2E) latency for two models: SGLang (non-deterministic and deterministic) and LLM-42 across multiple percentiles (2%, 5%, 10%, 20%, 50%, 100%). The x-axis represents latency in milliseconds (ms), and the y-axis represents the CDF (probability that latency is ≤ a given value). All lines start at the origin (0,0) and asymptotically approach 1.0 as latency increases.
### Components/Axes
- **X-axis**: E2E Latency (ms), ranging from 0 to 100,000 ms.
- **Y-axis**: CDF (0.0 to 1.0).
- **Legend**: Located in the bottom-right corner, with color-coded labels:
- Green: SGLang non-deterministic
- Red: SGLang deterministic
- Blue: LLM-42 @2%
- Orange: LLM-42 @5%
- Purple: LLM-42 @10%
- Brown: LLM-42 @20%
- Pink: LLM-42 @50%
- Cyan: LLM-42 @100%
### Detailed Analysis
1. **SGLang Lines**:
- **Green (non-deterministic)** and **Red (deterministic)** lines are nearly identical, overlapping for most of the latency range. Both reach ~0.95 CDF at ~20,000 ms and plateau near 1.0 by ~40,000 ms.
- The slight divergence at the start (0–5,000 ms) suggests minor differences in early latency distributions, but the lines converge quickly.
2. **LLM-42 Percentiles**:
- **Blue (@2%)**: The lowest latency distribution. Reaches ~0.95 CDF at ~15,000 ms and plateaus near 1.0 by ~30,000 ms.
- **Orange (@5%)**: Slightly higher than @2%, reaching ~0.95 CDF at ~18,000 ms.
- **Purple (@10%)**: Reaches ~0.95 CDF at ~22,000 ms.
- **Brown (@20%)**: Reaches ~0.95 CDF at ~28,000 ms.
- **Pink (@50%)**: Reaches ~0.95 CDF at ~40,000 ms.
- **Cyan (@100%)**: The highest latency distribution. Reaches ~0.95 CDF at ~60,000 ms and plateaus near 1.0 by ~80,000 ms.
### Key Observations
- **SGLang Consistency**: The non-deterministic and deterministic versions of SGLang exhibit nearly identical latency distributions, indicating minimal impact of determinism on latency.
- **LLM-42 Spread**: Higher percentiles (e.g., @100%) show significantly longer latencies compared to lower percentiles (e.g., @2%). The @100% line is the only one that extends beyond 60,000 ms.
- **Asymptotic Behavior**: All lines approach 1.0 CDF at different latency thresholds, reflecting the spread of latency distributions. The @100% line has the longest tail, suggesting a higher likelihood of extreme latency events.
### Interpretation
- **SGLang Performance**: The near-identical CDFs for SGLang's non-deterministic and deterministic models suggest that determinism does not significantly affect latency, which could simplify system design by avoiding trade-offs between determinism and performance.
- **LLM-42 Latency Trade-offs**: The LLM-42 model exhibits a clear trade-off between percentile and latency. While the @2% line ensures most requests are fast (<15,000 ms), the @100% line indicates a 100% probability of latency ≤80,000 ms, which may be unacceptable for latency-sensitive applications. This highlights the importance of percentile-based latency guarantees in real-world deployments.
- **Visual Consistency**: The legend's color coding aligns perfectly with the lines, confirming accurate data representation. The spatial placement of the legend (bottom-right) avoids overlap with the main chart, ensuring readability.
### Notable Trends
- **SGLang's Uniformity**: The green and red lines are nearly indistinguishable, suggesting that non-determinism in SGLang does not introduce significant latency variability.
- **LLM-42's Long Tail**: The @100% line (cyan) shows a pronounced tail, indicating that while most requests are fast, a small fraction experience extreme latency. This could be critical for applications requiring strict service-level agreements (SLAs).