## Line Graph: Percentage of Problems Solved vs. Number of Solutions per Problem
### Overview
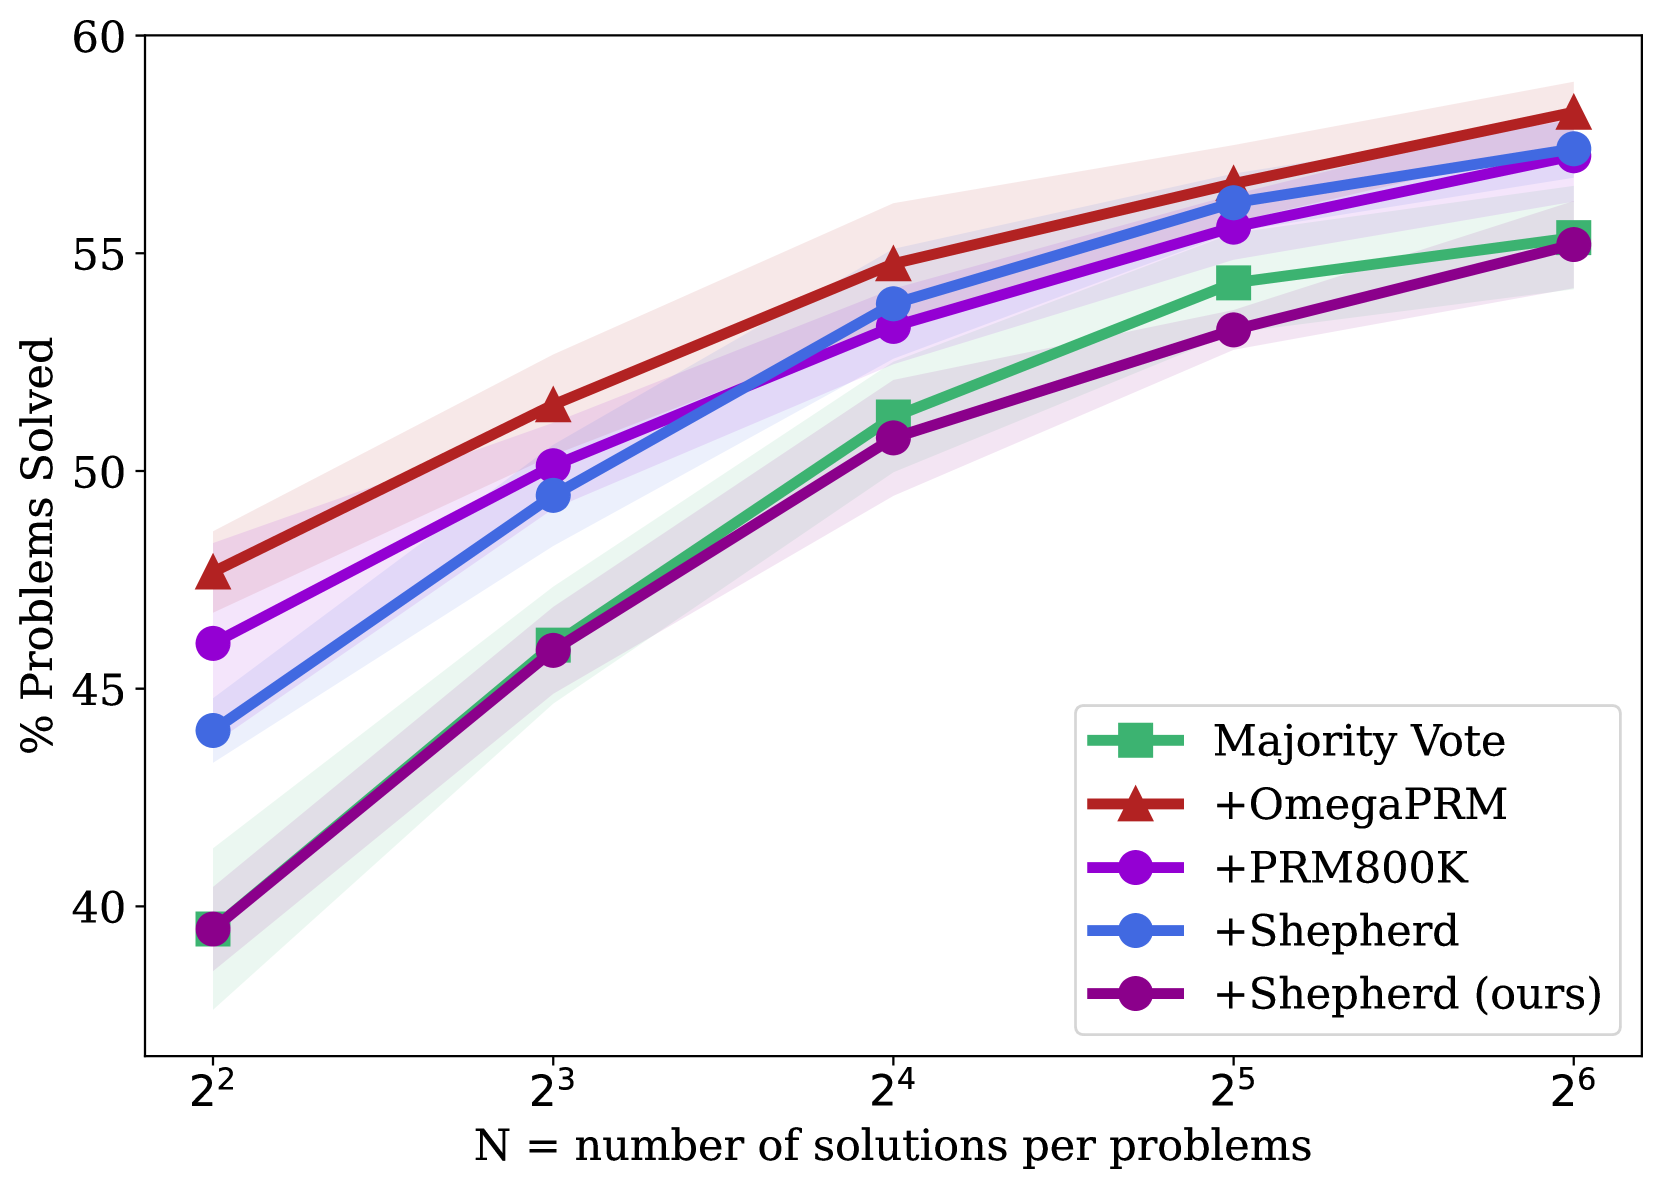
The graph illustrates the performance of five algorithms in solving problems as the number of solutions per problem (N) increases. The y-axis represents the percentage of problems solved (40–60%), while the x-axis shows N in powers of 2 (2² to 2⁶). Each algorithm is represented by a distinct line with markers and shaded confidence intervals.
### Components/Axes
- **X-axis**: "N = number of solutions per problems" (logarithmic scale: 2², 2³, 2⁴, 2⁵, 2⁶).
- **Y-axis**: "% Problems Solved" (linear scale: 40–60%).
- **Legend**: Located in the bottom-right corner, mapping colors/markers to algorithms:
- Green squares: Majority Vote
- Red triangles: +OmegaPRM
- Purple circles: +PRM800K
- Blue circles: +Shepherd
- Purple diamonds: +Shepherd (ours)
### Detailed Analysis
1. **Majority Vote (Green Squares)**:
- Starts at ~39.5% (N=2²) and rises to ~55% (N=2⁶).
- Shows a steady upward trend but remains the lowest-performing algorithm.
2. **+OmegaPRM (Red Triangles)**:
- Consistently the highest-performing algorithm.
- Begins at ~47.5% (N=2²) and reaches ~58% (N=2⁶).
- Shaded area indicates moderate variability.
3. **+PRM800K (Purple Circles)**:
- Starts at ~46% (N=2²) and climbs to ~57% (N=2⁶).
- Outperforms +Shepherd (ours) but lags behind +OmegaPRM and +Shepherd.
4. **+Shepherd (Blue Circles)**:
- Begins at ~44% (N=2²) and reaches ~57.5% (N=2⁶).
- Shows the second-strongest performance, closely following +OmegaPRM.
5. **+Shepherd (ours) (Purple Diamonds)**:
- Starts at ~39.5% (N=2²) and rises to ~55% (N=2⁶).
- Overlaps with +PRM800K at higher N values but underperforms at lower N.
### Key Observations
- **Performance Trends**: All algorithms improve as N increases, with diminishing returns at higher N values.
- **Outliers**: +OmegaPRM maintains a consistent lead, while Majority Vote remains the weakest.
- **Confidence Intervals**: Shaded regions suggest variability in performance, but trends are clear.
### Interpretation
The data demonstrates that increasing the number of solutions per problem (N) enhances algorithmic performance across all methods. +OmegaPRM is the most effective, likely due to its robust solution generation or prioritization strategy. +Shepherd and +PRM800K show strong performance, with +Shepherd (ours) closely matching +PRM800K at higher N. Majority Vote’s lower performance highlights its limitations in complex problem-solving scenarios. The shaded areas indicate that while confidence intervals widen slightly at higher N, the overall trends remain stable. This suggests that scaling N is a viable strategy for improving problem-solving efficiency, with algorithmic design playing a critical role in determining the ceiling of performance.