## 3D Surface Plot: True Error vs. x1 and x2
### Overview
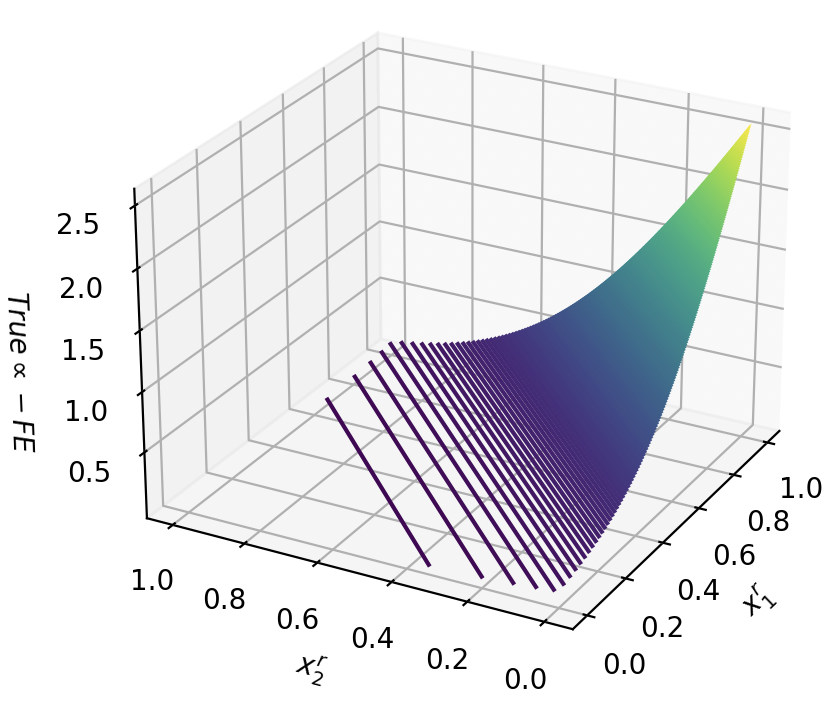
The image is a 3D surface plot visualizing the difference between a "True" value and a "FE" (likely Finite Element) approximation as a function of two variables, x1 and x2. The surface is colored, with the color gradient indicating the magnitude of the difference. The plot shows how the error changes across the x1-x2 plane.
### Components/Axes
* **X-axis:** Labeled "x1". Scale ranges from 0.0 to 1.0 in increments of 0.2.
* **Y-axis:** Labeled "x2". Scale ranges from 0.0 to 1.0 in increments of 0.2.
* **Z-axis:** Labeled "True α - FE". Scale ranges from 0.0 to 2.5 in increments of 0.5.
* **Surface Color:** The surface color varies from dark blue/purple at the origin to yellow at the top-right corner, indicating increasing values of "True α - FE".
### Detailed Analysis
* **Surface Trend:** The surface starts near zero at the origin (x1=0, x2=0) and rises sharply as both x1 and x2 increase. The rate of increase appears to be non-linear, possibly quadratic or exponential.
* **x1 = 0 Slice:** Along the x2 axis (x1=0), the "True α - FE" value remains close to zero for all values of x2.
* **x2 = 0 Slice:** Along the x1 axis (x2=0), the "True α - FE" value remains close to zero for all values of x1.
* **x1 = 1, x2 = 1:** At the point (x1=1, x2=1), the "True α - FE" value reaches its maximum, approximately 2.7.
* **Linear Projections:** There are dark purple lines projected onto the x1-x2 plane. These lines originate from the surface and extend down to the x1-x2 plane. They appear to be parallel and evenly spaced, providing a visual aid for understanding the surface's shape.
### Key Observations
* The error ("True α - FE") is minimal when either x1 or x2 is close to zero.
* The error increases significantly as both x1 and x2 approach 1.
* The surface exhibits a non-linear relationship between x1, x2, and the error.
### Interpretation
The plot suggests that the Finite Element (FE) approximation is most accurate when either x1 or x2 is small. As both x1 and x2 increase, the FE approximation deviates significantly from the "True" value, leading to a substantial error. This could indicate that the FE model is less accurate in regions where both x1 and x2 are large, possibly due to boundary effects, mesh density, or other factors related to the FE method. The non-linear relationship suggests that the error is not simply additive with respect to x1 and x2, but rather a more complex interaction between them. The parallel lines projected onto the x1-x2 plane are a visual aid to help understand the slope of the surface.