# Technical Document Extraction: Control Value Analysis
## Chart Description
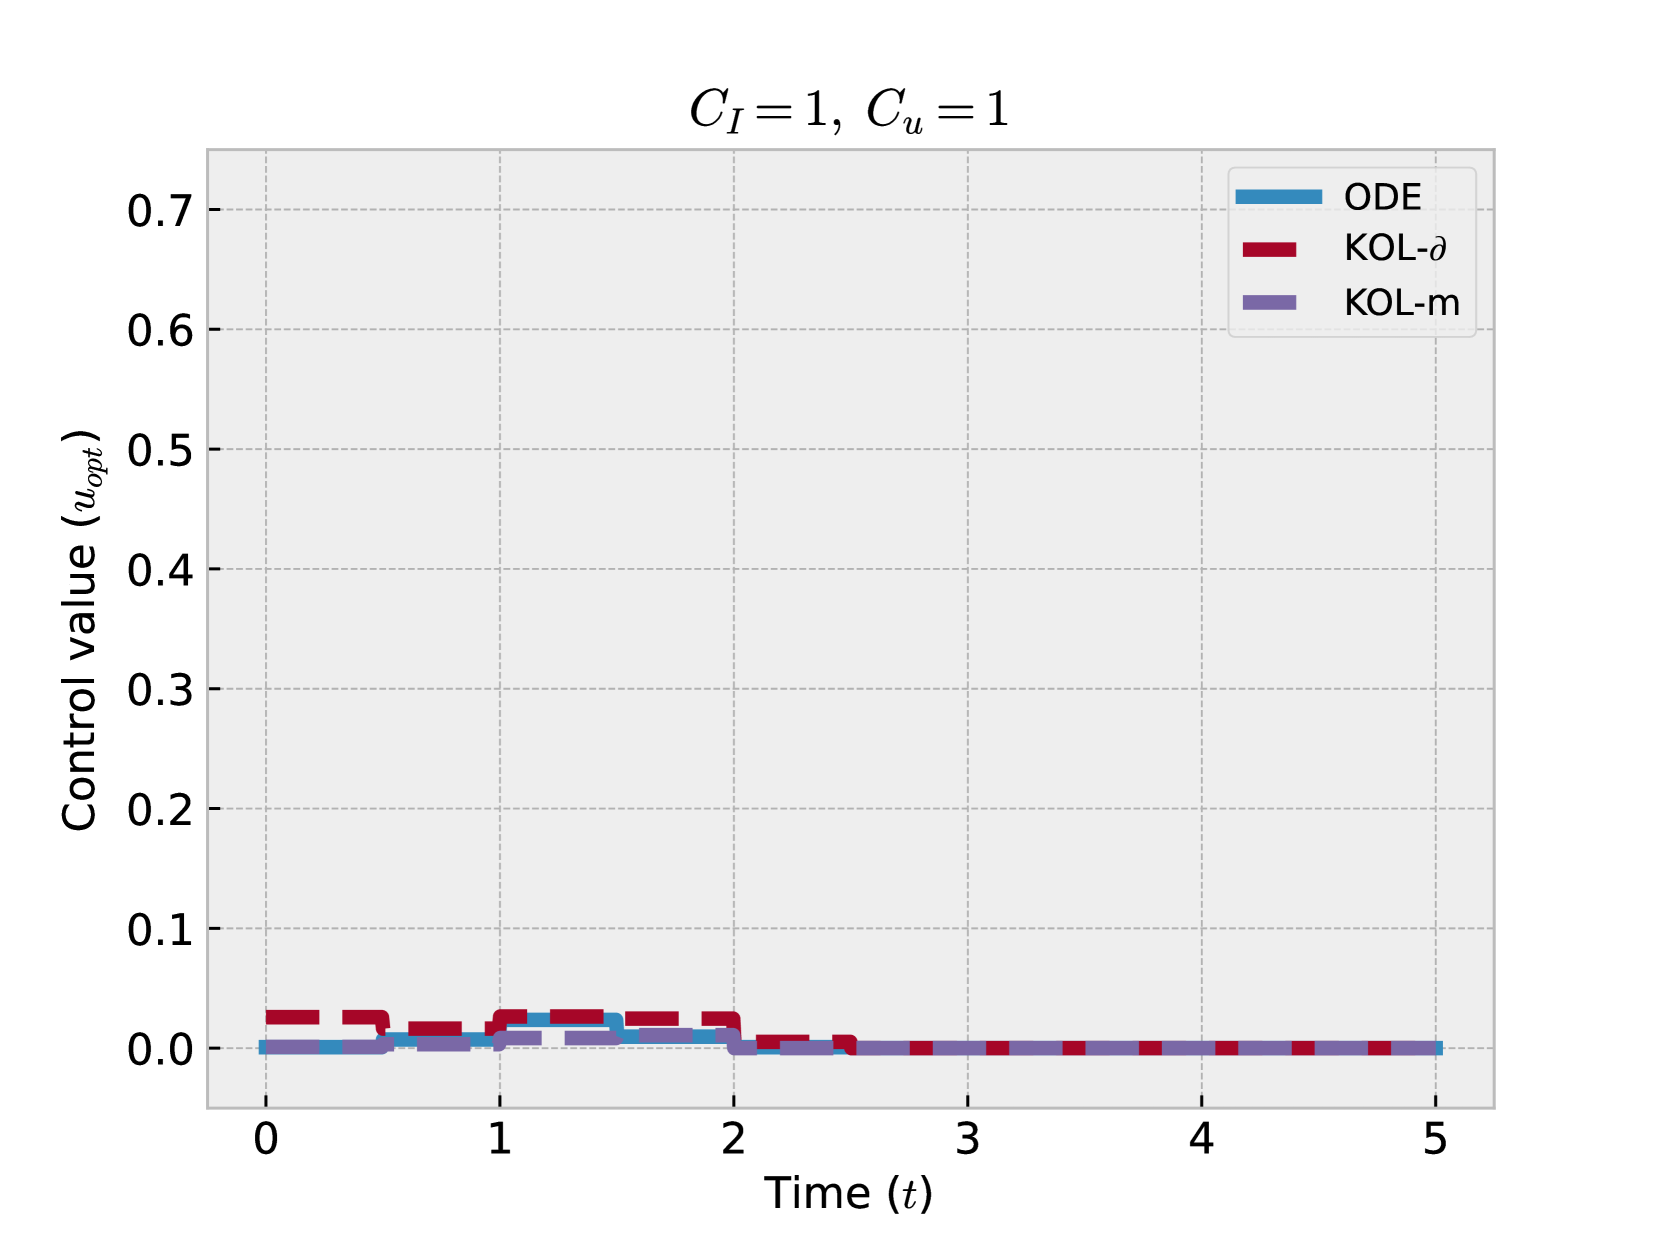
The image depicts a line graph comparing the performance of three control strategies over time. The graph is titled **"C_I = 1, C_u = 1"**, indicating fixed parameters for the control system.
---
### Axis Labels
- **X-axis**: **Time (t)**
- Scale: 0 to 5 (linear increments of 1)
- Units: Dimensionless time steps
- **Y-axis**: **Control value (u_opt)**
- Scale: 0.0 to 0.7 (linear increments of 0.1)
- Units: Dimensionless control magnitude
---
### Legend
- **ODE**: Blue line
- **KOL-δ**: Red line
- **KOL-m**: Purple line
---
### Key Trends and Data Points
1. **Initial Response (t = 0 to t = 1.5)**
- **ODE (Blue)**:
- Rises sharply to ~0.02 at t = 0.5.
- Drops to 0.0 at t = 1.0.
- **KOL-δ (Red)**:
- Peaks at ~0.02 at t = 0.5.
- Drops to 0.0 at t = 1.0.
- **KOL-m (Purple)**:
- Remains at 0.0 throughout.
2. **Secondary Response (t = 1.5 to t = 2.5)**
- **ODE (Blue)**:
- Rises to ~0.01 at t = 1.75.
- Drops to 0.0 at t = 2.0.
- **KOL-δ (Red)**:
- Peaks at ~0.01 at t = 1.75.
- Drops to 0.0 at t = 2.0.
- **KOL-m (Purple)**:
- Remains at 0.0 throughout.
3. **Steady State (t = 2.5 to t = 5)**
- All strategies stabilize at **u_opt = 0.0**.
---
### Observations
- **ODE and KOL-δ** exhibit transient control actions with identical magnitude and timing, suggesting similar dynamic responses under the tested conditions.
- **KOL-m** shows no control action, remaining at the baseline value of 0.0.
- All strategies achieve zero control value by t = 2.5, indicating system stabilization.
---
### Cross-Referenced Legend Accuracy
- Blue (ODE) and red (KOL-δ) lines align with their respective legend entries.
- Purple (KOL-m) line consistently matches its legend label.
---
### Conclusion
The graph demonstrates that ODE and KOL-δ strategies produce identical transient control responses, while KOL-m remains inactive. All strategies converge to a steady state with no control action by t = 2.5.