## Flowchart: Process for Answering Complex Questions
### Overview
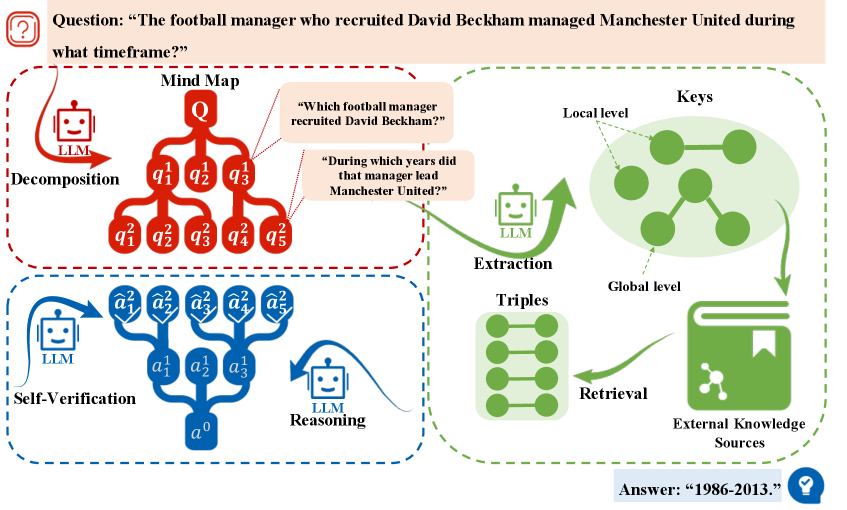
The image depicts a structured flowchart illustrating a multi-step process for answering complex questions using decomposition, self-verification, extraction, and retrieval. The flowchart uses color-coded sections (red, blue, green) to represent distinct stages and integrates external knowledge sources. The final answer provided is "1986-2013," linked to a historical query about David Beckham's recruitment timeline.
### Components/Axes
1. **Red Dashed Box (Mind Map - Decomposition)**
- **Labels**:
- "Q" (Main Question): "The football manager who recruited David Beckham managed Manchester United during what timeframe?"
- Sub-questions:
- `q1`, `q2`, `q3` (primary decomposition)
- `q1_1` to `q1_5`, `q2_1` to `q2_5`, `q3_1` to `q3_5` (further breakdown)
- **Flow**:
- Arrows from "Q" branch into sub-questions, indicating hierarchical decomposition.
2. **Blue Box (Self-Verification & Reasoning)**
- **Labels**:
- "Self-Verification": Arrows from `a1_1` to `a1_5` (hypotheses) to `a0` (final answer).
- "LLM Reasoning": Connects `a0` to the final answer.
- **Flow**:
- Blue arrows represent iterative verification and logical synthesis of answers.
3. **Green Dashed Box (Keys - Extraction & Retrieval)**
- **Labels**:
- "Local level" and "Global level" (knowledge hierarchies).
- "Triples": Structured data points (e.g., manager-recruitment-year relationships).
- "External Knowledge Sources": Icon of a book with a molecular structure.
- **Flow**:
- Green arrows link decomposition to extraction, retrieval, and synthesis of external data.
4. **Legend & Color Coding**
- **Red**: Decomposition of questions.
- **Blue**: Self-verification and reasoning.
- **Green**: Extraction, retrieval, and external knowledge integration.
### Detailed Analysis
- **Decomposition**:
The main question (`Q`) is split into three primary sub-questions (`q1`, `q2`, `q3`), each further divided into five granular components (e.g., `q1_1` to `q1_5`). This suggests a systematic breakdown of the query into verifiable components.
- **Self-Verification**:
Hypotheses (`a1_1` to `a1_5`) are tested against the original question, with verified answers (`a0`) synthesized through LLM reasoning. This step ensures accuracy by cross-checking intermediate results.
- **Extraction & Retrieval**:
The green section emphasizes leveraging both local (e.g., manager-specific data) and global (e.g., historical timelines) knowledge. "Triples" (e.g., "manager → recruited → Beckham → years") represent structured facts extracted from external sources.
- **Answer Synthesis**:
The final answer ("1986-2013") is derived by integrating verified sub-answers (`a0`) with retrieved knowledge, demonstrating a closed-loop process.
### Key Observations
1. **Hierarchical Question Breakdown**:
The decomposition into `q1_1` to `q3_5` ensures granularity, enabling targeted verification of each sub-question.
2. **Iterative Verification**:
The blue "Self-Verification" loop highlights the importance of cross-checking hypotheses before finalizing answers.
3. **Knowledge Integration**:
The green "Keys" section underscores the fusion of local (specific) and global (general) data, critical for contextual accuracy.
4. **Structured Output**:
The answer "1986-2013" is explicitly tied to the manager’s tenure, linking recruitment events to historical timelines.
### Interpretation
The flowchart represents a **knowledge graph-based reasoning framework** for answering complex queries. By decomposing questions into verifiable sub-components, iteratively testing hypotheses, and integrating structured data from external sources, the process ensures robust and accurate answers. The example answer ("1986-2013") demonstrates how this framework resolves historical queries by connecting managerial decisions (e.g., recruiting Beckham) to specific timeframes.
**Notable Patterns**:
- The use of color coding (red/blue/green) visually separates distinct cognitive stages, aiding in process clarity.
- The "Triples" structure suggests a knowledge graph approach, where relationships between entities (manager, player, years) are explicitly modeled.
**Underlying Logic**:
The diagram aligns with Peircean abductive reasoning: starting with an observation (Beckham’s recruitment), forming hypotheses (managerial timelines), testing them against data (extraction/retrieval), and refining the explanation (self-verification). This mirrors scientific inquiry, emphasizing iterative validation and knowledge integration.