## Heatmaps: Model Comparison Metrics
### Overview
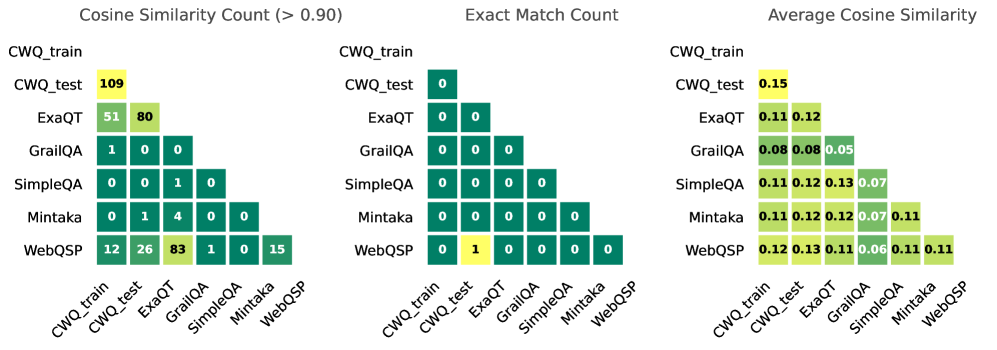
The image presents three comparative heatmaps analyzing question-answering models (CWQ_train, CWQ_test, ExaQT, GrailQA, SimpleQA, Mintaka, WebQSP) across three metrics:
1. **Cosine Similarity Count (>0.90)**
2. **Exact Match Count**
3. **Average Cosine Similarity**
Values are color-coded (yellow=highest, green=medium, dark green=lowest) and positioned in a matrix format.
---
### Components/Axes
- **X-axis (Columns)**: Models compared as reference points (CWQ_train, CWQ_test, ExaQT, GrailQA, SimpleQA, Mintaka, WebQSP).
- **Y-axis (Rows)**: Models being evaluated against the reference points.
- **Legend**:
- **Yellow**: Highest values (e.g., 109, 0.15).
- **Green**: Medium values (e.g., 80, 0.12).
- **Dark Green**: Lowest values (e.g., 0, 0.05).
- **Placement**: Legend is positioned to the right of each heatmap.
---
### Detailed Analysis
#### 1. **Cosine Similarity Count (>0.90)**
- **CWQ_train vs CWQ_test**: 109 (yellow).
- **ExaQT vs CWQ_train**: 51 (green), **ExaQT vs CWQ_test**: 80 (green).
- **GrailQA**: All values ≤1 (dark green).
- **SimpleQA**: 1 match (dark green) in SimpleQA vs Mintaka.
- **Mintaka**: 4 matches (green) in Mintaka vs ExaQT.
- **WebQSP**: 12 (green) vs CWQ_train, 26 (green) vs CWQ_test, 83 (yellow) vs GrailQA, 15 (dark green) vs WebQSP.
#### 2. **Exact Match Count**
- **All values are 0** except:
- **WebQSP vs CWQ_test**: 1 (yellow).
#### 3. **Average Cosine Similarity**
- **CWQ_train vs CWQ_test**: 0.15 (yellow).
- **ExaQT**: 0.11 (vs CWQ_train), 0.12 (vs CWQ_test).
- **GrailQA**: 0.08 (vs CWQ_train/CWQ_test), 0.05 (self-comparison).
- **SimpleQA**: 0.11–0.13 (vs CWQ_train/CWQ_test), 0.07 (self-comparison).
- **Mintaka**: 0.11–0.12 (vs CWQ_train/CWQ_test), 0.07 (vs SimpleQA), 0.11 (self-comparison).
- **WebQSP**: 0.12–0.13 (vs CWQ_train/CWQ_test), 0.06 (vs GrailQA), 0.11 (self-comparison).
---
### Key Observations
1. **Dominance of CWQ_train/CWQ_test**:
- Highest Cosine Similarity Count (109) and Average Similarity (0.15) between CWQ_train and CWQ_test.
- Suggests these models share significant structural or data overlap.
2. **ExaQT Performance**:
- Strong similarity to CWQ_train/test (51–80 matches, 0.11–0.12 average).
- Indicates potential alignment with CWQ frameworks.
3. **Sparse Exact Matches**:
- Only 1 exact match (WebQSP vs CWQ_test) across all models.
- Highlights rarity of identical outputs despite similarity.
4. **Model-Specific Trends**:
- **GrailQA/SimpleQA**: Low similarity (≤0.08 average), suggesting divergent approaches.
- **WebQSP**: Moderate similarity (0.12–0.13) but low exact matches, implying nuanced differences.
---
### Interpretation
- **CWQ Framework Centrality**: CWQ_train/test act as a hub, with ExaQT showing partial alignment. Other models (GrailQA, SimpleQA) diverge significantly, possibly due to architectural or training differences.
- **Similarity ≠ Exactness**: High cosine similarity (e.g., WebQSP vs CWQ_train: 0.12) does not guarantee exact matches, suggesting semantic vs. lexical differences.
- **Outliers**:
- **SimpleQA vs Mintaka**: 4 matches (green) despite low average similarity (0.07), indicating sporadic overlaps.
- **WebQSP Self-Comparison**: 0.11 average similarity but 0 exact matches, highlighting internal variability.
- **Implications**:
- CWQ and ExaQT may share foundational design principles.
- GrailQA/SimpleQA require further investigation to identify unique methodologies.
- WebQSP’s moderate similarity but low exactness suggests potential for refinement in alignment strategies.