\n
## Heatmap: Cosine Similarity and Match Counts Between Datasets
### Overview
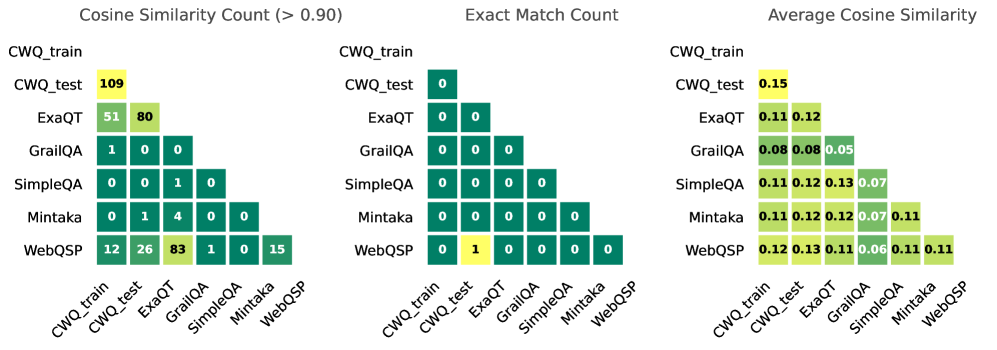
The image presents three heatmaps comparing different datasets (CWQ_train, CWQ_test, ExaQT, GrailQA, SimpleQA, Mintaka, WebQSP) based on cosine similarity and exact match counts. The heatmaps are arranged horizontally, with the first showing cosine similarity counts (above 0.90), the second showing exact match counts, and the third showing average cosine similarity. Each heatmap uses a color gradient to represent the magnitude of the values, with darker shades indicating higher values.
### Components/Axes
* **Datasets:** The datasets are listed on both the x-axis and y-axis of each heatmap: CWQ_train, CWQ_test, ExaQT, GrailQA, SimpleQA, Mintaka, WebQSP.
* **Heatmap 1 (Cosine Similarity Count (> 0.90)):** Values represent the number of times the cosine similarity between two datasets exceeds 0.90.
* **Heatmap 2 (Exact Match Count):** Values represent the number of exact matches between two datasets.
* **Heatmap 3 (Average Cosine Similarity):** Values represent the average cosine similarity between two datasets.
* **Color Scale:** The color scale is not explicitly provided, but it appears to range from light green (low values) to dark green (high values).
* **Placement:** The three heatmaps are positioned side-by-side horizontally. The dataset labels are positioned below each heatmap.
### Detailed Analysis or Content Details
**Heatmap 1: Cosine Similarity Count (> 0.90)**
* CWQ_train vs. CWQ_test: 109
* CWQ_train vs. ExaQT: 51
* CWQ_train vs. GrailQA: 1
* CWQ_train vs. SimpleQA: 0
* CWQ_train vs. Mintaka: 1
* CWQ_train vs. WebQSP: 12
* CWQ_test vs. ExaQT: 80
* CWQ_test vs. GrailQA: 0
* CWQ_test vs. SimpleQA: 0
* CWQ_test vs. Mintaka: 4
* CWQ_test vs. WebQSP: 26
* ExaQT vs. GrailQA: 0
* ExaQT vs. SimpleQA: 0
* ExaQT vs. Mintaka: 0
* ExaQT vs. WebQSP: 83
* GrailQA vs. SimpleQA: 0
* GrailQA vs. Mintaka: 0
* GrailQA vs. WebQSP: 0
* SimpleQA vs. Mintaka: 0
* SimpleQA vs. WebQSP: 0
* Mintaka vs. WebQSP: 15
**Heatmap 2: Exact Match Count**
* All values are 0, except:
* CWQ_train vs. CWQ_train: 0
* CWQ_test vs. CWQ_test: 0
* ExaQT vs. ExaQT: 0
* GrailQA vs. GrailQA: 0
* SimpleQA vs. SimpleQA: 0
* Mintaka vs. Mintaka: 0
* WebQSP vs. WebQSP: 0
* CWQ_train vs. WebQSP: 1
* WebQSP vs. CWQ_train: 1
**Heatmap 3: Average Cosine Similarity**
* CWQ_train vs. CWQ_test: 0.15
* CWQ_train vs. ExaQT: 0.11, 0.12
* CWQ_train vs. GrailQA: 0.08, 0.05
* CWQ_train vs. SimpleQA: 0.11, 0.12, 0.07
* CWQ_train vs. Mintaka: 0.11, 0.12, 0.07
* CWQ_train vs. WebQSP: 0.12, 0.12, 0.11
* CWQ_test vs. ExaQT: 0.11
* CWQ_test vs. GrailQA: 0.08
* CWQ_test vs. SimpleQA: 0.11
* CWQ_test vs. Mintaka: 0.11
* CWQ_test vs. WebQSP: 0.11
### Key Observations
* **High Cosine Similarity:** CWQ_train and CWQ_test exhibit the highest cosine similarity counts (>0.90), with a value of 109. This suggests a strong overlap between these two datasets.
* **Exact Matches are Rare:** Exact matches between datasets are extremely rare, with only two instances (CWQ_train vs. WebQSP and WebQSP vs. CWQ_train) having a count of 1.
* **WebQSP and ExaQT Correlation:** WebQSP shows relatively high cosine similarity counts with ExaQT (83 > 0.90).
* **Low Average Cosine Similarity:** The average cosine similarity values are generally low, ranging from 0.05 to 0.15, indicating a limited overall similarity between the datasets.
* **GrailQA is Distinct:** GrailQA consistently shows low cosine similarity counts and average cosine similarity values, suggesting it is quite different from the other datasets.
### Interpretation
The data suggests that while some datasets share a high degree of similarity (specifically CWQ_train and CWQ_test), most datasets are relatively distinct from each other. The scarcity of exact matches reinforces this observation. The high cosine similarity between CWQ_train and CWQ_test likely indicates that CWQ_test is a subset or a closely related variation of CWQ_train. The low average cosine similarity values suggest that these datasets cover different aspects of the underlying problem space, or are represented in different ways. The distinctness of GrailQA could be due to its unique data source, task formulation, or data processing pipeline. The heatmap provides a quantitative assessment of the relationships between these datasets, which can be valuable for tasks such as dataset selection, transfer learning, and model evaluation. The fact that exact matches are so rare suggests that the datasets are not simply duplicates or minor variations of each other.