TECHNICAL ASSET FINGERPRINT
abd983050aa82507ed6add9e
Click to view fullscreen
Press ESC or click to close
FOUND IN PAPERS
EXPERT: healer-alpha-free VERSION 1
RUNTIME: free/openrouter/healer-alpha
INTEL_VERIFIED
## Comparative Visualization: Gaussian Splatting Methods for Urban Scenes
### Overview
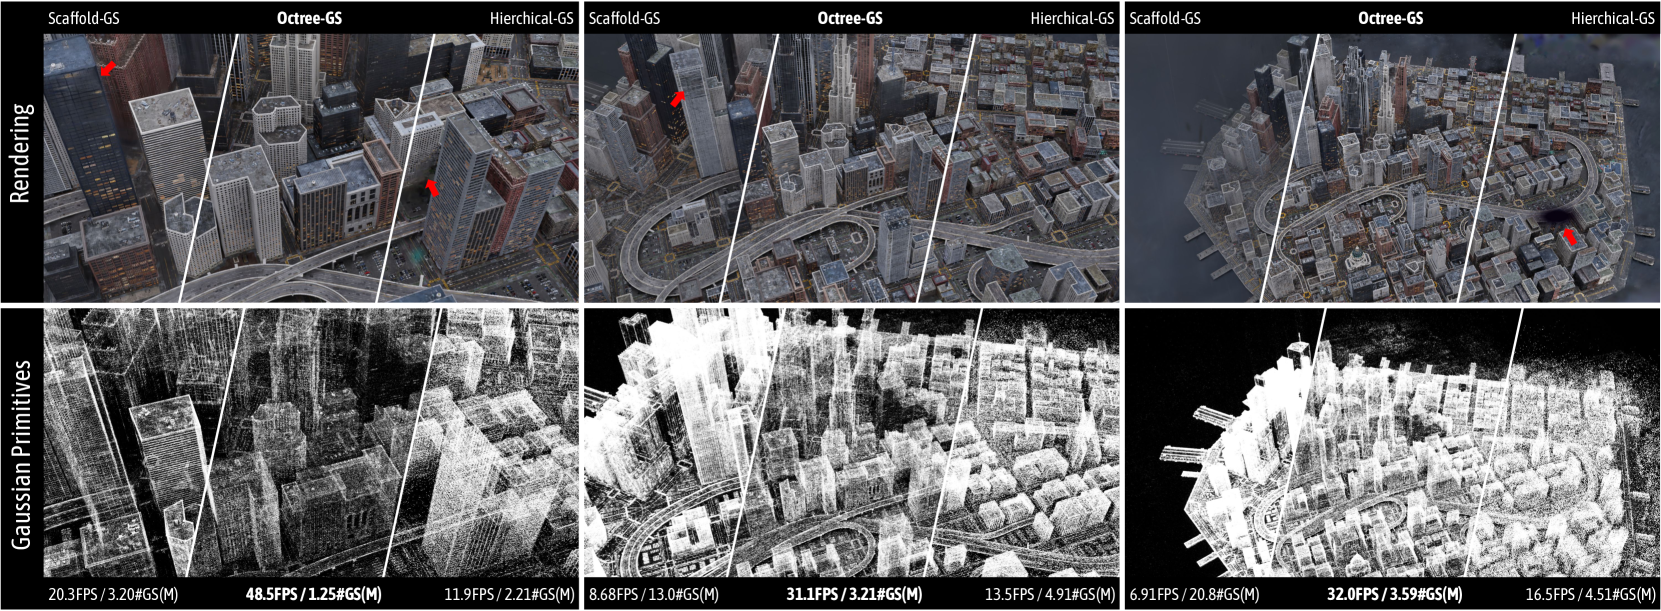
The image is a technical comparison grid showcasing three different Gaussian Splatting (GS) methods for rendering a complex 3D urban environment. It is structured as a 2x3 grid. The top row, labeled "Rendering," displays the final visual output of each method. The bottom row, labeled "Gaussian Primitives," visualizes the underlying geometric representation (the point cloud of Gaussian primitives) used to generate the renderings above. Each column corresponds to a specific method: Scaffold-GS, Octree-GS, and Hierarchical-GS. Performance metrics (Frames Per Second and Gaussian count in Millions) are provided at the bottom of each column.
### Components/Axes
* **Grid Structure:**
* **Rows:**
1. **Top Row:** Labeled "Rendering" on the far left. Shows the photorealistic 3D reconstruction of a city scene.
2. **Bottom Row:** Labeled "Gaussian Primitives" on the far left. Shows the corresponding point cloud representation, where each white dot/ellipsoid represents a Gaussian primitive.
* **Columns:** Each column is dedicated to one method, labeled at the top of both rows in that column:
1. **Left Column:** Scaffold-GS
2. **Middle Column:** Octree-GS
3. **Right Column:** Hierarchical-GS
* **Performance Metrics (Bottom of each column):** Text overlays provide two key metrics in the format `[Value]FPS / [Value]#GS(M)`.
* `FPS`: Rendering speed in Frames Per Second.
* `#GS(M)`: Number of Gaussian primitives in Millions.
* **Visual Annotations:** Red arrows are present in some of the "Rendering" images, pointing to specific areas of interest or potential artifacts.
### Detailed Analysis
**Column 1: Scaffold-GS**
* **Rendering (Top-Left):** Shows a detailed city block with skyscrapers. A red arrow points to the upper-left corner of a tall, dark building, possibly indicating a rendering artifact or a point of comparison.
* **Gaussian Primitives (Bottom-Left):** The point cloud is dense and appears to have a structured, scaffold-like organization, with clear vertical and horizontal alignments corresponding to building edges and surfaces.
* **Performance Metrics:** `20.3FPS / 3.20#GS(M)`
**Column 2: Octree-GS**
* **Rendering (Top-Middle):** Shows a similar but slightly different city view, featuring a prominent circular highway interchange. A red arrow points to the side of a tall, light-colored building.
* **Gaussian Primitives (Bottom-Middle):** The point cloud appears less uniformly structured than Scaffold-GS. Primitives seem clustered, potentially following an octree spatial partitioning scheme. The density appears high in complex areas.
* **Performance Metrics:** `8.68FPS / 13.0#GS(M)` (Note: This is the lowest FPS and highest primitive count in the set).
**Column 3: Hierarchical-GS**
* **Rendering (Top-Right):** Shows a wider, more aerial view of the cityscape, including a waterfront area. A red arrow points to a small, isolated red object (possibly a vehicle or sign) on a road in the lower-right quadrant.
* **Gaussian Primitives (Bottom-Right):** The point cloud shows a clear hierarchical or multi-resolution structure. There is a very dense, bright white core representing major structures, surrounded by a sparser cloud of primitives for less detailed areas.
* **Performance Metrics:** `6.91FPS / 20.8#GS(M)` (Note: This has the lowest FPS and by far the highest primitive count).
**Cross-Method Performance Comparison:**
* **FPS Trend:** Scaffold-GS (20.3) > Octree-GS (8.68) > Hierarchical-GS (6.91). Scaffold-GS is significantly faster.
* **Primitive Count (#GS) Trend:** Hierarchical-GS (20.8M) > Octree-GS (13.0M) > Scaffold-GS (3.20M). There is an inverse relationship between speed and primitive count in this comparison.
### Key Observations
1. **Speed vs. Fidelity Trade-off:** There is a clear inverse correlation between rendering speed (FPS) and the number of Gaussian primitives used. The method with the fewest primitives (Scaffold-GS) is the fastest, while the method with the most primitives (Hierarchical-GS) is the slowest.
2. **Primitive Distribution:** The visualizations of the Gaussian primitives reveal fundamentally different underlying data structures:
* **Scaffold-GS:** Appears structured and efficient, aligning with geometric features.
* **Octree-GS:** Shows dense, localized clustering.
* **Hierarchical-GS:** Exhibits a multi-scale, dense core with sparse periphery.
3. **Visual Quality:** All three methods produce recognizable and detailed urban scenes in the "Rendering" row. The red arrows likely highlight subtle differences in reconstruction quality, such as edge sharpness, artifact presence, or small object fidelity, which are difficult to quantify from this overview alone.
4. **Scene Scale:** The Hierarchical-GS column (right) appears to render a larger geographical area of the city compared to the other two columns, which may contribute to its higher primitive count.
### Interpretation
This image serves as a qualitative and quantitative comparison of efficiency and representation in modern 3D reconstruction techniques. The data suggests a fundamental engineering trade-off:
* **Scaffold-GS** prioritizes **efficiency and speed**. Its low primitive count and high FPS make it suitable for real-time applications (e.g., VR/AR, simulation) where performance is critical, potentially at the cost of some fine-grained detail or flexibility.
* **Octree-GS** and **Hierarchical-GS** prioritize **representational density and potentially higher fidelity**. Their much higher primitive counts suggest they capture more scene detail or use more complex data structures to organize it. However, this comes at a severe performance cost, making them more suitable for offline rendering, high-quality visualization, or as a research benchmark for maximum reconstruction quality.
The red arrows are investigative cues, directing the viewer to compare specific challenging regions (e.g., building edges, small objects) across methods. The "Gaussian Primitives" row is crucial for understanding *why* performance differs—it visually exposes the computational burden (number of primitives) and the organizational strategy (scaffold vs. octree vs. hierarchy) that each method employs. The choice of method, therefore, depends entirely on the application's priority: real-time performance (favoring Scaffold-GS) versus maximum representational detail (favoring Hierarchical-GS).
DECODING INTELLIGENCE...