## Chart Type: Cumulative Distribution Plots
### Overview
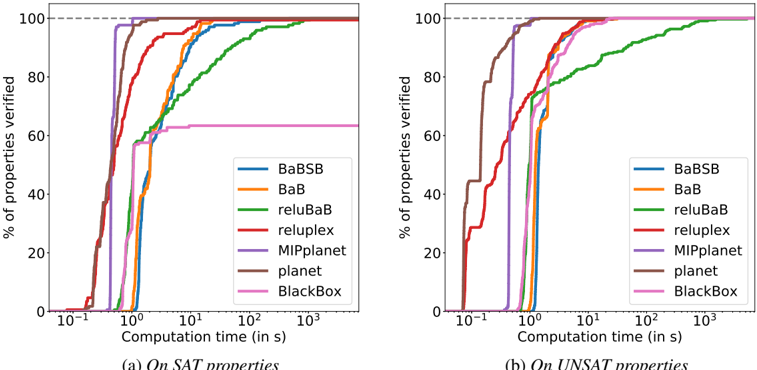
The image contains two cumulative distribution plots comparing the performance of different verification methods on SAT and UNSAT properties. The plots show the percentage of properties verified against the computation time in seconds (log scale).
### Components/Axes
* **X-axis (both plots):** Computation time (in s), logarithmic scale from 10<sup>-1</sup> to 10<sup>3</sup>.
* **Y-axis (both plots):** % of properties verified, linear scale from 0 to 100.
* **Plot Titles:** (a) *On SAT properties*, (b) *On UNSAT properties*
* **Legend (right side of each plot):**
* Blue: BaBSB
* Orange: BaB
* Green: reluBaB
* Red: reluplex
* Purple: MIPplanet
* Brown: planet
* Pink: BlackBox
* **Horizontal dashed line:** At 100% properties verified.
### Detailed Analysis
**Plot (a): On SAT properties**
* **BaBSB (Blue):** The line starts at approximately 0% around 10<sup>-1</sup> s, rises sharply to 60% around 10<sup>0</sup> s, then gradually increases to 100% around 10<sup>2</sup> s.
* **BaB (Orange):** The line starts at approximately 0% around 10<sup>-1</sup> s, rises sharply to 60% around 10<sup>0</sup> s, then gradually increases to 100% around 10<sup>2</sup> s.
* **reluBaB (Green):** The line starts at approximately 0% around 10<sup>-1</sup> s, rises sharply to 70% around 10<sup>0</sup> s, then gradually increases to 100% around 10<sup>2</sup> s.
* **reluplex (Red):** The line starts at approximately 0% around 10<sup>-1</sup> s, rises sharply to 100% around 10<sup>0</sup> s.
* **MIPplanet (Purple):** The line starts at approximately 0% around 10<sup>-1</sup> s, rises sharply to 60% around 10<sup>0</sup> s, then remains constant.
* **planet (Brown):** The line starts at approximately 0% around 10<sup>-1</sup> s, rises sharply to 100% around 10<sup>0</sup> s.
* **BlackBox (Pink):** The line starts at approximately 0% around 10<sup>-1</sup> s, rises sharply to 100% around 10<sup>0</sup> s.
**Plot (b): On UNSAT properties**
* **BaBSB (Blue):** The line starts at approximately 0% around 10<sup>-1</sup> s, rises sharply to 40% around 10<sup>0</sup> s, then gradually increases to 100% around 10<sup>3</sup> s.
* **BaB (Orange):** The line starts at approximately 0% around 0% around 10<sup>-1</sup> s, rises sharply to 20% around 10<sup>0</sup> s, then gradually increases to 100% around 10<sup>3</sup> s.
* **reluBaB (Green):** The line starts at approximately 0% around 10<sup>-1</sup> s, rises sharply to 40% around 10<sup>0</sup> s, then gradually increases to 100% around 10<sup>3</sup> s.
* **reluplex (Red):** The line starts at approximately 0% around 10<sup>-1</sup> s, rises sharply to 60% around 10<sup>0</sup> s, then gradually increases to 100% around 10<sup>3</sup> s.
* **MIPplanet (Purple):** The line starts at approximately 0% around 10<sup>-1</sup> s, rises sharply to 40% around 10<sup>0</sup> s, then gradually increases to 100% around 10<sup>3</sup> s.
* **planet (Brown):** The line starts at approximately 0% around 10<sup>-1</sup> s, rises sharply to 80% around 10<sup>0</sup> s, then gradually increases to 100% around 10<sup>1</sup> s.
* **BlackBox (Pink):** The line starts at approximately 0% around 10<sup>-1</sup> s, rises sharply to 20% around 10<sup>0</sup> s, then gradually increases to 100% around 10<sup>3</sup> s.
### Key Observations
* For SAT properties, reluplex, planet, and BlackBox are the fastest, reaching 100% verification around 10<sup>0</sup> seconds.
* For SAT properties, MIPplanet plateaus at around 60% verification.
* For UNSAT properties, planet is the fastest, reaching 100% verification around 10<sup>1</sup> seconds.
* For UNSAT properties, all methods eventually reach 100% verification, but the time required varies significantly.
* The performance of the methods differs significantly between SAT and UNSAT properties.
### Interpretation
The plots compare the efficiency of different verification methods in verifying SAT and UNSAT properties. The cumulative distribution plots show the proportion of properties that can be verified within a given time limit. The results indicate that some methods (reluplex, planet, BlackBox) are significantly faster for SAT properties, while planet is the fastest for UNSAT properties. The plateau of MIPplanet for SAT properties suggests it may not be suitable for all SAT problems. The difference in performance between SAT and UNSAT properties highlights the importance of choosing the right verification method based on the type of problem.