\n
## Line Charts: Performance of Verification Methods on SAT and UNSAT Properties
### Overview
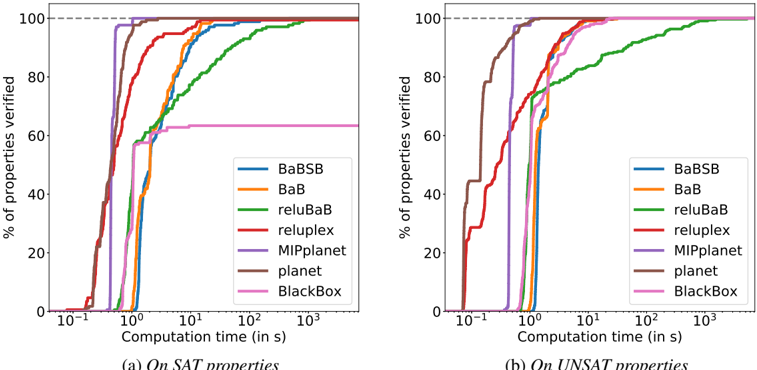
The image displays two side-by-side line charts comparing the performance of seven different computational verification methods. The charts plot the percentage of properties verified against computation time on a logarithmic scale. Chart (a) is titled "On SAT properties" and chart (b) is titled "On UNSAT properties."
### Components/Axes
* **X-Axis (Both Charts):** "Computation time (in s)". The scale is logarithmic, with major tick marks at 10⁻¹ (0.1), 10⁰ (1), 10¹ (10), 10² (100), and 10³ (1000) seconds.
* **Y-Axis (Both Charts):** "% of properties verified". The scale is linear from 0 to 100, with major tick marks every 20 units (0, 20, 40, 60, 80, 100).
* **Reference Line:** A horizontal dashed grey line is present at the 100% mark on both charts.
* **Legend (Bottom-Right of each chart):** A box containing seven colored lines and their corresponding method names:
* Blue line: BaBSB
* Orange line: BaB
* Green line: reluBaB
* Red line: reluplex
* Purple line: MIPplanet
* Brown line: planet
* Pink line: BlackBox
* **Subplot Labels:** Below each chart: "(a) On SAT properties" and "(b) On UNSAT properties".
### Detailed Analysis
#### Chart (a): On SAT properties
* **Trend Verification & Data Points:**
* **MIPplanet (Purple):** Exhibits the fastest initial rise. It reaches ~95% verification by approximately 0.5 seconds and approaches 100% shortly after 1 second.
* **planet (Brown):** Also rises very quickly, reaching ~90% by 0.5 seconds and converging to 100% near 2 seconds.
* **reluplex (Red):** Shows a steep, steady climb. It passes 50% at ~0.8 seconds, 80% at ~2 seconds, and reaches 100% around 10 seconds.
* **BaBSB (Blue) & BaB (Orange):** Follow very similar trajectories. They begin rising significantly after 1 second, cross 50% at ~3-4 seconds, and reach 100% between 10 and 20 seconds.
* **reluBaB (Green):** Has a more gradual slope. It starts rising after 1 second, reaches 50% at ~10 seconds, 80% at ~100 seconds, and approaches 100% near 1000 seconds.
* **BlackBox (Pink):** Rises quickly to a plateau. It reaches ~60% verification by about 2 seconds and shows no further improvement, remaining flat at ~60% for all longer computation times.
#### Chart (b): On UNSAT properties
* **Trend Verification & Data Points:**
* **planet (Brown):** Is the fastest performer here. It reaches ~90% by 0.3 seconds and 100% by approximately 1 second.
* **MIPplanet (Purple):** Also performs very well, reaching ~95% by 1 second and 100% shortly thereafter.
* **reluplex (Red):** Rises steeply, passing 50% at ~0.5 seconds and reaching 100% around 5 seconds.
* **BaBSB (Blue) & BaB (Orange):** Again show similar performance. They begin their ascent after 0.5 seconds, cross 50% at ~2 seconds, and reach 100% between 5 and 10 seconds.
* **reluBaB (Green):** Has the most gradual slope. It reaches 50% at ~5 seconds, 80% at ~50 seconds, and approaches 100% near 500 seconds.
* **BlackBox (Pink):** Follows a similar pattern to chart (a), plateauing early. It reaches ~95% verification by about 2 seconds and remains at that level, never reaching 100%.
### Key Observations
1. **Performance Hierarchy:** For both SAT and UNSAT properties, `planet` and `MIPplanet` are consistently the fastest methods to verify a high percentage of properties. `reluBaB` is consistently the slowest.
2. **SAT vs. UNSAT Difference:** The relative ordering of methods is similar, but the absolute performance differs. Most methods verify UNSAT properties faster than SAT properties (e.g., `reluplex` reaches 100% in ~5s for UNSAT vs. ~10s for SAT). The exception is `BlackBox`, which performs worse on UNSAT properties, plateauing at ~95% instead of ~60%.
3. **BlackBox Plateau:** The `BlackBox` method exhibits a distinct performance ceiling in both scenarios, failing to verify all properties regardless of additional computation time.
4. **Clustering:** `BaBSB` and `BaB` form a tight cluster with nearly identical performance curves in both charts.
### Interpretation
These charts provide a comparative benchmark of formal verification or neural network analysis tools. The data suggests that methods based on Mixed-Integer Programming (`MIPplanet`) and specific abstraction techniques (`planet`) are highly efficient for the tested property sets. The steep curves of the top performers indicate they solve "easy" instances very quickly, with diminishing returns for harder instances.
The plateau of `BlackBox` is a critical finding, indicating a fundamental limitation in its approach—it cannot verify a subset of properties, likely due to incompleteness or lack of guarantees. The similar performance of `BaBSB` and `BaB` suggests they may share a common algorithmic core. The overall faster verification of UNSAT properties might imply that proving property violation (finding a counterexample) is computationally easier for these tools than proving property satisfaction for this benchmark suite. This analysis is crucial for selecting the right tool based on the expected property type (SAT/UNSAT) and available time budget.