# Technical Document Extraction: Bar Chart Analysis
## Chart Structure
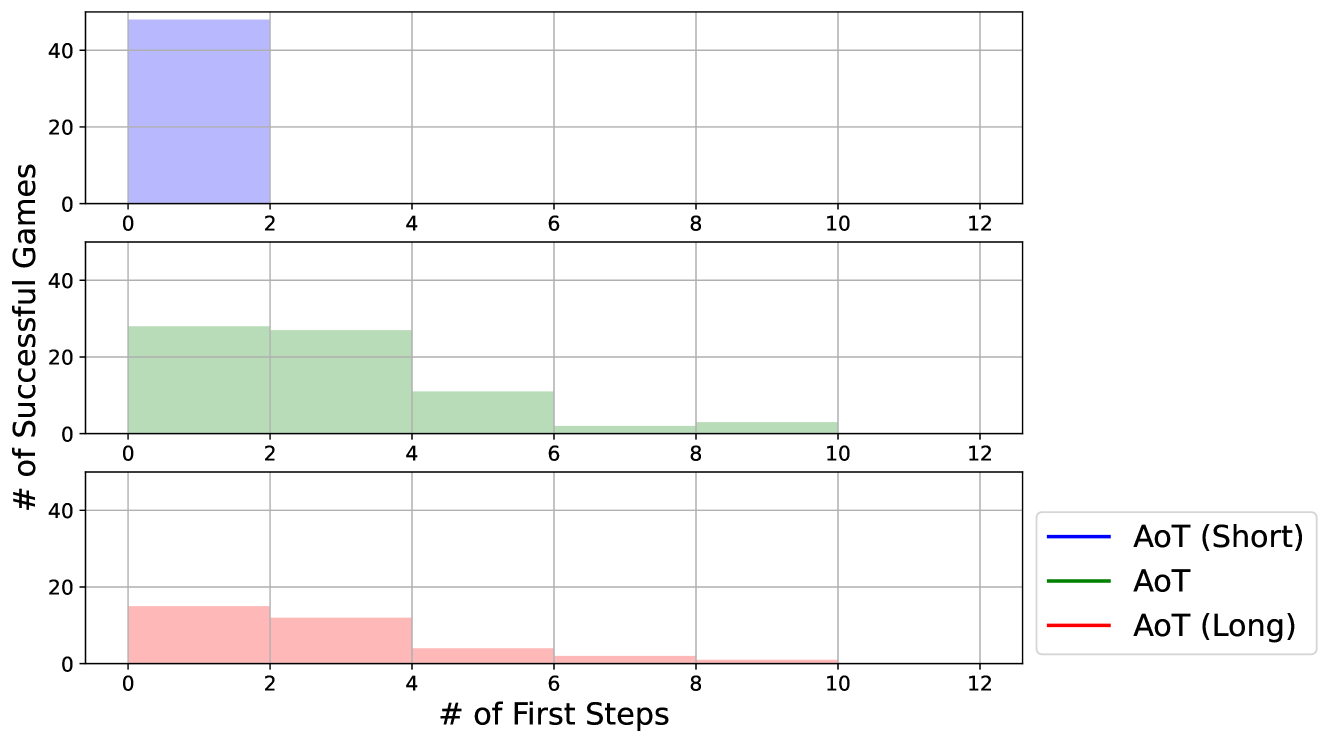
- **Chart Type**: Stacked bar charts (3 separate charts)
- **Axes**:
- **X-axis**: "# of First Steps" (0–12, increments of 2)
- **Y-axis**: "# of Successful Games" (0–40, increments of 20)
- **Legend**:
- **Blue**: AoT (Short)
- **Green**: AoT
- **Red**: AoT (Long)
---
## Chart 1: AoT (Short) [Blue]
- **Data Points**:
- X=0: 40 successful games
- X=2–12: 0 successful games
- **Trend**: All successes occur at 0 first steps; no success beyond this threshold.
---
## Chart 2: AoT [Green]
- **Data Points**:
- X=0: 25 successful games
- X=2: 25 successful games
- X=4: 15 successful games
- X=6: 5 successful games
- X=8: 2 successful games
- X=10: 2 successful games
- X=12: 0 successful games
- **Trend**: Success decreases as first steps increase, with a gradual decline after X=4.
---
## Chart 3: AoT (Long) [Red]
- **Data Points**:
- X=0: 15 successful games
- X=2: 10 successful games
- X=4: 5 successful games
- X=6: 2 successful games
- X=8: 1 successful game
- X=10: 1 successful game
- X=12: 0 successful games
- **Trend**: Success declines more steeply than AoT, with minimal success beyond X=6.
---
## Cross-Reference Validation
- **Legend Colors**:
- Blue (AoT Short) matches Chart 1.
- Green (AoT) matches Chart 2.
- Red (AoT Long) matches Chart 3.
- **Axis Consistency**: All charts share identical axis labels and scales.
---
## Summary
- **AoT (Short)** achieves maximum success at 0 first steps with no success beyond this.
- **AoT** and **AoT (Long)** show diminishing returns as first steps increase, with AoT (Long) performing worse overall.