## Heatmap: Numerical Values
### Overview
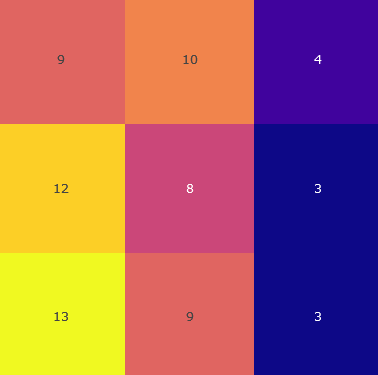
The image is a 3x3 heatmap displaying numerical values within each cell. The color intensity corresponds to the magnitude of the number, with lighter colors representing higher values and darker colors representing lower values.
### Components/Axes
* The heatmap consists of a 3x3 grid.
* Each cell contains a numerical value.
* The color gradient ranges from dark blue (low values) to yellow (high values).
### Detailed Analysis
Here's a breakdown of the values and their corresponding colors:
* **Top Row:**
* Left Cell: Value = 9, Color = Light Red/Salmon
* Middle Cell: Value = 10, Color = Orange
* Right Cell: Value = 4, Color = Dark Purple
* **Middle Row:**
* Left Cell: Value = 12, Color = Yellow-Orange
* Middle Cell: Value = 8, Color = Pink
* Right Cell: Value = 3, Color = Dark Blue
* **Bottom Row:**
* Left Cell: Value = 13, Color = Yellow
* Middle Cell: Value = 9, Color = Light Red/Salmon
* Right Cell: Value = 3, Color = Dark Blue
### Key Observations
* The highest value (13) is located in the bottom-left cell and is represented by the lightest color (yellow).
* The lowest values (3) are located in the bottom-right and middle-right cells and are represented by the darkest color (dark blue).
* The values generally decrease from left to right within each row.
* The values are higher in the bottom row compared to the top row.
### Interpretation
The heatmap visually represents the distribution of numerical values across a 3x3 grid. The color gradient allows for a quick assessment of the relative magnitudes of the values. The data suggests a concentration of higher values in the bottom-left corner and lower values in the right column. This type of visualization is useful for identifying patterns and trends in data.