\n
## Line Chart: I-Don't-Know Rate vs. Layer for Llama Models
### Overview
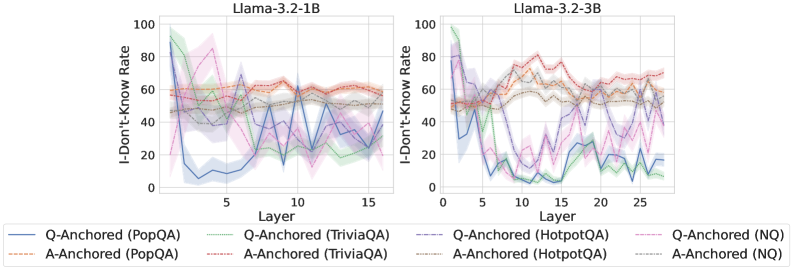
The image presents two line charts comparing the "I-Don't-Know Rate" across different layers of two Llama models: Llama-3.2-1B and Llama-3.2-3B. The charts display the rate for different question-answering datasets (PopQA, TriviaQA, HotpotQA, and NQ) and anchoring methods (Q-Anchored and A-Anchored). The x-axis represents the "Layer" number, and the y-axis represents the "I-Don't-Know Rate" in percentage.
### Components/Axes
* **X-axis:** "Layer" - Ranges from 0 to 15 for the Llama-3.2-1B chart and 0 to 25 for the Llama-3.2-3B chart.
* **Y-axis:** "I-Don't-Know Rate" - Ranges from 0 to 100, representing percentage.
* **Title (Left Chart):** "Llama-3.2-1B"
* **Title (Right Chart):** "Llama-3.2-3B"
* **Legend:** Located at the bottom of each chart. The legend entries are:
* Q-Anchored (PopQA) - Solid Blue Line
* A-Anchored (PopQA) - Dashed Orange Line
* Q-Anchored (TriviaQA) - Solid Purple Line
* A-Anchored (TriviaQA) - Dashed Brown Line
* Q-Anchored (HotpotQA) - Dashed Gray Line
* A-Anchored (HotpotQA) - Solid Gray Line
* Q-Anchored (NQ) - Dashed Teal Line
* A-Anchored (NQ) - Solid Teal Line
### Detailed Analysis or Content Details
**Llama-3.2-1B Chart:**
* **Q-Anchored (PopQA):** Starts at approximately 90%, rapidly decreases to a minimum of around 20% at layer 4, then fluctuates between 30% and 60% until layer 15.
* **A-Anchored (PopQA):** Starts at approximately 70%, decreases to around 40% at layer 3, then remains relatively stable between 40% and 60% until layer 15.
* **Q-Anchored (TriviaQA):** Starts at approximately 80%, decreases to a minimum of around 25% at layer 4, then increases to around 50% at layer 10, and fluctuates between 40% and 60% until layer 15.
* **A-Anchored (TriviaQA):** Starts at approximately 60%, decreases to around 35% at layer 3, then remains relatively stable between 40% and 60% until layer 15.
* **Q-Anchored (HotpotQA):** Starts at approximately 60%, decreases to around 30% at layer 3, then fluctuates between 30% and 50% until layer 15.
* **A-Anchored (HotpotQA):** Starts at approximately 50%, decreases to around 30% at layer 3, then remains relatively stable between 30% and 50% until layer 15.
* **Q-Anchored (NQ):** Starts at approximately 70%, decreases to around 30% at layer 3, then fluctuates between 30% and 50% until layer 15.
* **A-Anchored (NQ):** Starts at approximately 50%, decreases to around 30% at layer 3, then remains relatively stable between 30% and 50% until layer 15.
**Llama-3.2-3B Chart:**
* **Q-Anchored (PopQA):** Starts at approximately 90%, decreases to a minimum of around 20% at layer 4, then fluctuates between 30% and 60% until layer 25.
* **A-Anchored (PopQA):** Starts at approximately 70%, decreases to around 40% at layer 3, then remains relatively stable between 40% and 60% until layer 25.
* **Q-Anchored (TriviaQA):** Starts at approximately 80%, decreases to a minimum of around 25% at layer 4, then increases to around 50% at layer 10, and fluctuates between 40% and 60% until layer 25.
* **A-Anchored (TriviaQA):** Starts at approximately 60%, decreases to around 35% at layer 3, then remains relatively stable between 40% and 60% until layer 25.
* **Q-Anchored (HotpotQA):** Starts at approximately 60%, decreases to around 30% at layer 3, then fluctuates between 30% and 50% until layer 25.
* **A-Anchored (HotpotQA):** Starts at approximately 50%, decreases to around 30% at layer 3, then remains relatively stable between 30% and 50% until layer 25.
* **Q-Anchored (NQ):** Starts at approximately 70%, decreases to around 30% at layer 3, then fluctuates between 30% and 50% until layer 25.
* **A-Anchored (NQ):** Starts at approximately 50%, decreases to around 30% at layer 3, then remains relatively stable between 30% and 50% until layer 25.
### Key Observations
* All lines in both charts exhibit a significant initial drop in "I-Don't-Know Rate" within the first few layers (0-4).
* The "I-Don't-Know Rate" generally stabilizes after layer 5 for the Llama-3.2-1B model and after layer 10 for the Llama-3.2-3B model.
* Q-Anchored methods consistently show higher "I-Don't-Know Rates" compared to A-Anchored methods across all datasets.
* PopQA and TriviaQA datasets generally have higher "I-Don't-Know Rates" than HotpotQA and NQ.
* The Llama-3.2-3B model shows a more prolonged period of fluctuation in the "I-Don't-Know Rate" compared to the Llama-3.2-1B model.
### Interpretation
The charts demonstrate how the "I-Don't-Know Rate" changes as information propagates through the layers of the Llama models. The initial sharp decrease suggests that the early layers are crucial for acquiring basic knowledge and reducing uncertainty. The subsequent stabilization indicates that the models reach a point where further layers contribute less to reducing the rate of not knowing.
The difference between Q-Anchored and A-Anchored methods suggests that the way questions are anchored (whether based on the question itself or the answer) impacts the model's confidence. Q-Anchoring appears to lead to more uncertainty, potentially because it requires the model to reason more deeply about the question's intent.
The varying rates across datasets likely reflect the inherent difficulty of the questions within each dataset. PopQA and TriviaQA, being more general knowledge-based, may present more ambiguous or challenging questions compared to HotpotQA and NQ, which are more focused and structured.
The longer fluctuation period in the Llama-3.2-3B model could indicate that the larger model has a greater capacity for learning and adapting, but also that it requires more layers to fully converge on a stable state. This suggests a more complex internal representation of knowledge.