\n
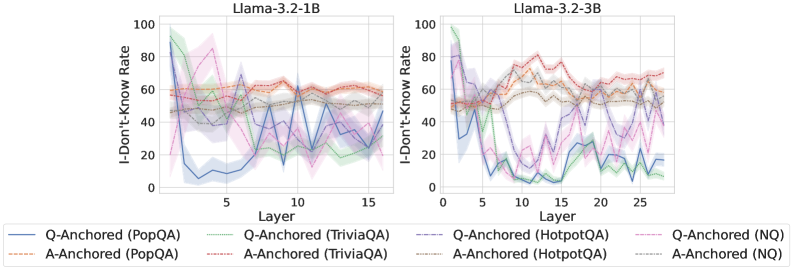
## Line Charts: "I-Don't-Know Rate" Across Model Layers for Llama-3.2 Models
### Overview
The image displays two side-by-side line charts comparing the "I-Don't-Know Rate" across the internal layers of two different-sized language models: Llama-3.2-1B (left) and Llama-3.2-3B (right). The charts track how the model's tendency to express uncertainty (an "I don't know" response) changes as information propagates through its layers, using two different prompting methods ("Q-Anchored" and "A-Anchored") across four different question-answering datasets.
### Components/Axes
* **Chart Titles:**
* Left Chart: `Llama-3.2-1B`
* Right Chart: `Llama-3.2-3B`
* **Y-Axis (Both Charts):** Label: `I-Don't-Know Rate`. Scale: 0 to 100, with major tick marks at 0, 20, 40, 60, 80, 100.
* **X-Axis (Both Charts):** Label: `Layer`.
* Left Chart Scale: 0 to 15, with major tick marks at 0, 5, 10, 15.
* Right Chart Scale: 0 to 25, with major tick marks at 0, 5, 10, 15, 20, 25.
* **Legend (Bottom, spanning both charts):** Contains 8 entries, each a combination of an anchoring method and a dataset. The legend is positioned below the X-axes of both charts.
1. `Q-Anchored (PopQA)` - Solid blue line.
2. `A-Anchored (PopQA)` - Dashed orange line.
3. `Q-Anchored (TriviaQA)` - Solid green line.
4. `A-Anchored (TriviaQA)` - Dashed red line.
5. `Q-Anchored (HotpotQA)` - Solid purple line.
6. `A-Anchored (HotpotQA)` - Dashed brown line.
7. `Q-Anchored (NQ)` - Solid pink line.
8. `A-Anchored (NQ)` - Dashed gray line.
### Detailed Analysis
**Chart 1: Llama-3.2-1B (Left)**
* **General Trend:** The "Q-Anchored" lines (solid) show high initial rates (60-100) that drop dramatically within the first 3-5 layers, then exhibit significant volatility (spikes and dips) between layers 5 and 15. The "A-Anchored" lines (dashed) are much more stable, generally hovering between 40 and 70 across all layers with less pronounced fluctuations.
* **Key Data Points (Approximate):**
* **Q-Anchored (PopQA - Blue):** Starts ~95 at layer 0, plummets to ~10 by layer 3, then fluctuates between ~5 and ~60.
* **Q-Anchored (TriviaQA - Green):** Starts ~100, drops to ~20 by layer 5, then shows a notable spike back to ~60 around layer 10 before falling again.
* **A-Anchored (All Datasets):** All four dashed lines cluster in the 40-70 band. For example, A-Anchored (PopQA - Orange) remains near 60 for most layers.
**Chart 2: Llama-3.2-3B (Right)**
* **General Trend:** Similar initial drop for Q-Anchored lines, but the subsequent behavior differs. The volatility in later layers appears more pronounced, and the separation between some lines is clearer. The A-Anchored lines again show more stability but with a slightly wider spread than in the 1B model.
* **Key Data Points (Approximate):**
* **Q-Anchored (TriviaQA - Green):** Starts ~100, drops to near 0 around layer 10, then shows a slight recovery to ~10-20 by layer 25.
* **Q-Anchored (PopQA - Blue):** Starts ~90, drops to ~10 by layer 5, then fluctuates between ~5 and ~30.
* **A-Anchored (TriviaQA - Red):** Shows a distinct upward trend from ~50 at layer 0 to a peak of ~80 around layer 12, before settling back to ~70.
* **A-Anchored (HotpotQA - Brown):** Remains relatively flat around 50-60.
### Key Observations
1. **Anchoring Method Dominance:** The most striking pattern is the fundamental difference between Q-Anchored and A-Anchored prompting. Q-Anchored leads to high initial uncertainty that is rapidly reduced in early layers but becomes unstable. A-Anchored results in a more consistent, moderate level of uncertainty throughout the network.
2. **Model Size Effect:** The larger 3B model (right chart) shows more extreme behavior for some Q-Anchored lines (e.g., TriviaQA dropping to near zero) and more distinct trends for some A-Anchored lines (e.g., TriviaQA's rise and fall) compared to the 1B model.
3. **Dataset Variability:** The effect is not uniform across datasets. For instance, the Q-Anchored (TriviaQA) line behaves very differently from Q-Anchored (PopQA) in both models, suggesting the model's uncertainty dynamics are sensitive to the type of knowledge being queried.
4. **Layer-wise Volatility:** The middle layers (approx. 5-15 for 1B, 5-20 for 3B) are regions of high volatility for the Q-Anchored method, where the "I-Don't-Know Rate" can swing by 40-50 points between adjacent layers.
### Interpretation
This data suggests that the **prompting strategy (anchoring) fundamentally alters how uncertainty is processed within the model's layers**. The "Q-Anchored" method (likely prompting with the question) creates a state of high initial uncertainty that the model aggressively tries to resolve in its first few layers, but this process is noisy and unstable in deeper layers. In contrast, the "A-Anchored" method (likely prompting with a potential answer) establishes a more stable, baseline level of uncertainty that persists, possibly indicating a more cautious or verification-focused processing mode.
The differences between the 1B and 3B models imply that **larger models may develop more specialized or pronounced internal mechanisms for handling uncertainty**, as seen in the more extreme dips and clearer trends. The variation across datasets indicates that the model's confidence is not a monolithic property but is **contingent on the specific domain or type of factual knowledge** involved.
From a technical document perspective, this visualization is crucial for understanding the **internal "epistemology" of large language models**—how they manage and express uncertainty as information flows through their architecture. It provides empirical evidence that model behavior can be steered not just by the final output layer, but by interventions (like anchoring) that affect processing in the middle layers.