## Line Graph: I-Don't-Know Rate Across Llama Model Layers for Different QA Datasets
### Overview
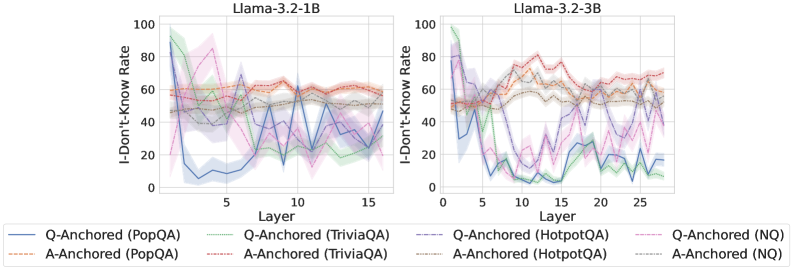
The image contains two line graphs comparing the "I-Don't-Know Rate (%)" across transformer model layers for two Llama architectures (Llama-3.2-1B and Llama-3.2-3B). Each graph includes six data series representing different question-answering (QA) datasets and anchoring methods (Q-Anchored vs. A-Anchored). The graphs show significant variability in I-Don't-Know rates across layers, with overlapping confidence intervals (shaded regions) indicating uncertainty.
### Components/Axes
- **X-Axis (Layer)**:
- Llama-3.2-1B: Layers 0–15 (discrete increments).
- Llama-3.2-3B: Layers 0–25 (discrete increments).
- **Y-Axis (I-Don't-Know Rate)**:
- Scale: 0% to 100% (linear).
- **Legends**:
- **Llama-3.2-1B**:
- Solid blue: Q-Anchored (PopQA)
- Dashed green: Q-Anchored (TriviaQA)
- Dotted orange: A-Anchored (PopQA)
- Dashed red: A-Anchored (TriviaQA)
- Solid purple: Q-Anchored (HotpotQA)
- Dashed pink: Q-Anchored (NQ)
- **Llama-3.2-3B**:
- Solid blue: Q-Anchored (PopQA)
- Dashed green: Q-Anchored (TriviaQA)
- Dotted orange: A-Anchored (PopQA)
- Dashed red: A-Anchored (TriviaQA)
- Solid purple: Q-Anchored (HotpotQA)
- Dashed pink: Q-Anchored (NQ)
### Detailed Analysis
#### Llama-3.2-1B
- **Q-Anchored (PopQA)**:
- Starts at ~80% in Layer 0, drops sharply to ~20% by Layer 5, then fluctuates between ~30–60% until Layer 15.
- Confidence interval (shaded blue) widens significantly after Layer 5.
- **A-Anchored (PopQA)**:
- Relatively stable, hovering between ~50–70% with minimal variation.
- **Q-Anchored (TriviaQA)**:
- Peaks at ~90% in Layer 0, drops to ~40% by Layer 5, then oscillates between ~30–70%.
- **A-Anchored (TriviaQA)**:
- Starts at ~60%, dips to ~40% by Layer 5, then stabilizes around ~50–60%.
- **Q-Anchored (HotpotQA)**:
- Sharp decline from ~100% in Layer 0 to ~10% by Layer 5, followed by erratic fluctuations.
- **Q-Anchored (NQ)**:
- Begins at ~70%, drops to ~30% by Layer 5, then fluctuates between ~20–60%.
#### Llama-3.2-3B
- **Q-Anchored (PopQA)**:
- Starts at ~90%, drops to ~30% by Layer 5, then fluctuates between ~20–70% with increasing volatility.
- **A-Anchored (PopQA)**:
- Stable between ~60–80%, with slight upward trend after Layer 10.
- **Q-Anchored (TriviaQA)**:
- Peaks at ~85% in Layer 0, drops to ~20% by Layer 5, then rises to ~70% by Layer 25.
- **A-Anchored (TriviaQA)**:
- Starts at ~50%, dips to ~30% by Layer 5, then stabilizes around ~40–60%.
- **Q-Anchored (HotpotQA)**:
- Sharp decline from ~100% in Layer 0 to ~5% by Layer 5, followed by erratic spikes (e.g., ~40% at Layer 15).
- **Q-Anchored (NQ)**:
- Begins at ~80%, drops to ~10% by Layer 5, then fluctuates between ~10–60%.
### Key Observations
1. **Layer-Specific Variability**:
- Early layers (0–5) exhibit extreme I-Don't-Know rates (often >50%), while later layers show more moderate values.
- Q-Anchored datasets generally show sharper declines in early layers compared to A-Anchored datasets.
2. **Model Size Differences**:
- Llama-3.2-3B demonstrates greater variability in later layers (e.g., Layer 25) compared to Llama-3.2-1B.
3. **Dataset-Specific Trends**:
- HotpotQA consistently shows the highest initial I-Don't-Know rates, dropping sharply in early layers.
- NQ datasets exhibit the most erratic fluctuations across layers.
4. **Anchoring Method Impact**:
- A-Anchored datasets (PopQA, TriviaQA) display smoother trends, suggesting better layer-wise generalization.
### Interpretation
The data suggests that anchoring methods (Q vs. A) significantly influence the I-Don't-Know rates across transformer layers. Q-Anchored datasets exhibit higher variability and sharper declines in early layers, potentially indicating over-reliance on specific training patterns. A-Anchored datasets show more stable performance, implying better generalization. The Llama-3.2-3B model’s increased layer count correlates with heightened variability in later layers, possibly due to architectural complexity. Dataset-specific behaviors (e.g., HotpotQA’s extreme early-layer drops) highlight differences in training data complexity. These trends underscore the importance of anchoring strategies in mitigating model uncertainty during inference.