## Diagram: Progressive 3D Model Rendering
### Overview
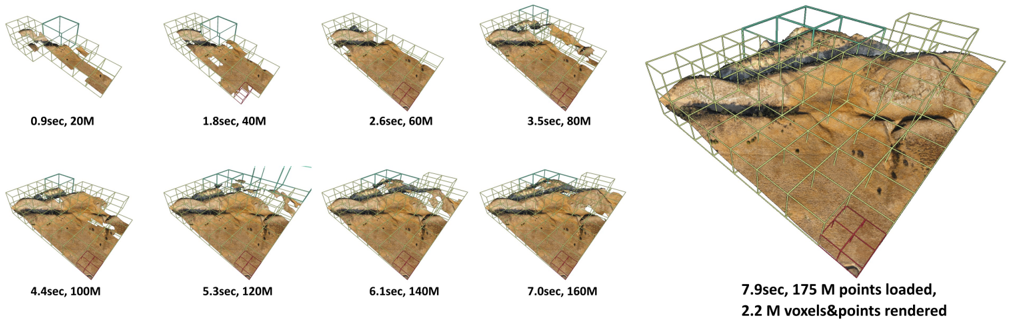
The image shows a series of 3D model renderings at different stages of completion, demonstrating the progressive loading and rendering of points and voxels over time. The model appears to be a terrain or landscape. The renderings are displayed in a sequence from left to right, top to bottom, showing increasing detail and complexity. Each rendering is accompanied by a time stamp and the number of points loaded.
### Components/Axes
* **Renderings:** Nine separate renderings of the same 3D model at different stages of completion. Each rendering is enclosed within a wireframe grid.
* **Time Stamps:** Each rendering has a corresponding time stamp in the format "X.Xsec, YM", where X.X is the time in seconds and Y is the number of points loaded in millions.
* **Wireframe Grid:** A blue-green wireframe grid surrounds each rendering, providing a visual reference for the model's dimensions and voxel structure. A red grid is visible in the bottom corner of each rendering.
* **Final Rendering Details:** The final rendering includes the text "7.9sec, 175 M points loaded, 2.2 M voxels&points rendered".
### Detailed Analysis
The image presents a sequence of renderings, each showing the progressive loading and rendering of a 3D model. The model appears to be a terrain or landscape with varying elevations and textures.
* **Rendering 1:** (0.9sec, 20M) - The initial rendering shows a very sparse representation of the terrain, with only a few points loaded. The wireframe grid is visible, and the terrain is barely discernible.
* **Rendering 2:** (1.8sec, 40M) - More points are loaded, and the basic shape of the terrain starts to become clearer.
* **Rendering 3:** (2.6sec, 60M) - The terrain's features become more defined, with some indication of elevation changes.
* **Rendering 4:** (3.5sec, 80M) - The terrain is more detailed, with some texture visible.
* **Rendering 5:** (4.4sec, 100M) - Further refinement of the terrain, with more points loaded.
* **Rendering 6:** (5.3sec, 120M) - The terrain is becoming increasingly detailed, with more texture and elevation changes visible.
* **Rendering 7:** (6.1sec, 140M) - The terrain is almost fully rendered, with a high level of detail.
* **Rendering 8:** (7.0sec, 160M) - The terrain is nearly complete, with only minor refinements remaining.
* **Rendering 9:** (7.9sec, 175 M points loaded, 2.2 M voxels&points rendered) - The final rendering shows the fully rendered terrain with a high level of detail and texture. The text indicates that 175 million points were loaded and 2.2 million voxels and points were rendered.
### Key Observations
* The number of points loaded increases linearly with time.
* The visual quality of the rendering improves significantly as more points are loaded.
* The final rendering provides a detailed representation of the terrain, with realistic textures and elevation changes.
### Interpretation
The image demonstrates the progressive loading and rendering of a 3D model, showcasing how the visual quality improves as more data is processed. The sequence of renderings provides a clear illustration of the trade-off between rendering time and visual fidelity. The final rendering shows the result of loading and rendering a large number of points and voxels, resulting in a detailed and realistic representation of the terrain. The red grid in the bottom corner of each rendering likely serves as a scale reference.