\n
## Diagram: Progressive Mesh Loading & Rendering
### Overview
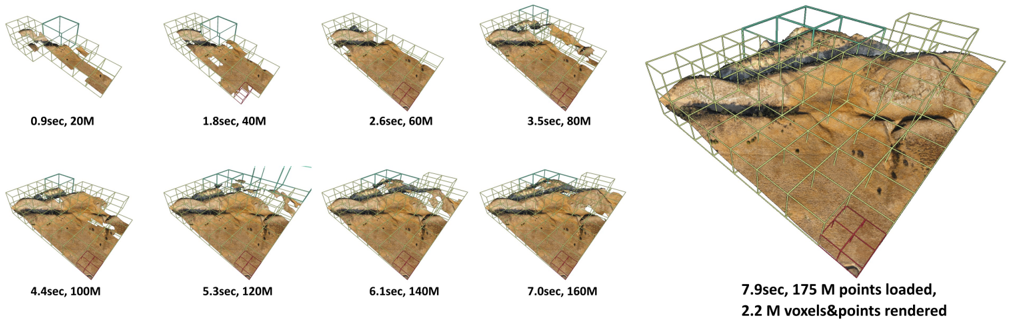
The image depicts a series of nine isometric views of a 3D mesh representing a terrain or excavation site. Each view shows the mesh at a different stage of loading and rendering, indicated by the time elapsed and the number of points/voxels loaded. The views are arranged horizontally across two rows, demonstrating the progressive refinement of the model as more data is processed. A wireframe cube surrounds the mesh in each view, likely representing the bounding volume or loading area.
### Components/Axes
There are no explicit axes or legends in the traditional sense. The data is presented visually through the progression of the mesh and accompanying text labels. The key parameters displayed are:
* **Time (seconds):** Indicates the time taken to reach a particular loading/rendering state.
* **Points/Voxels (Millions):** Indicates the number of points loaded or voxels rendered.
### Detailed Analysis or Content Details
The image shows the following stages of loading and rendering:
1. **0.9 sec, 20M:** The initial state, showing a very sparse mesh.
2. **1.8 sec, 40M:** The mesh is becoming more defined, with more points loaded.
3. **2.6 sec, 60M:** Further refinement of the mesh.
4. **3.5 sec, 80M:** Continued increase in mesh density.
5. **4.4 sec, 100M:** The mesh is becoming more detailed.
6. **5.3 sec, 120M:** Further refinement of the mesh.
7. **6.1 sec, 140M:** Continued increase in mesh density.
8. **7.0 sec, 160M:** The mesh is becoming more detailed.
9. **7.9 sec, 175 M points loaded, 2.2 M voxels&points rendered:** The final state, showing a highly detailed mesh with a significant number of points loaded and voxels rendered. The red bounding box highlights a specific area of the mesh.
The wireframe cube appears to shrink in size relative to the mesh as more data is loaded, suggesting that the loading process is focused on filling the cube with detail. The darker areas within the mesh likely represent subsurface features or areas of shadow.
### Key Observations
* There is a roughly linear relationship between time elapsed and the number of points loaded/voxels rendered.
* The rate of increase in points/voxels appears to slow down slightly towards the end of the process.
* The final state (7.9 sec) shows a significantly more detailed mesh than the initial states.
* The red bounding box in the final image suggests a focus on a specific region of interest.
### Interpretation
This diagram demonstrates a progressive loading and rendering technique for a 3D mesh. The data suggests that the system is capable of efficiently loading and rendering large datasets, with a relatively smooth increase in detail over time. The linear relationship between time and data loaded indicates a consistent processing rate. The slowing down of the rate of increase towards the end could be due to factors such as increased rendering complexity or limitations in the rendering pipeline. The red bounding box suggests that the system may be optimized for rendering specific areas of interest within the mesh. This technique is likely used in applications such as terrain visualization, geological modeling, or archaeological reconstruction, where large datasets need to be rendered in real-time or near real-time. The progressive loading allows for a quick initial display of the model, followed by gradual refinement as more data becomes available.