## Bar Chart: Comparison of Responses on Impact-Resistant Material Design
### Overview
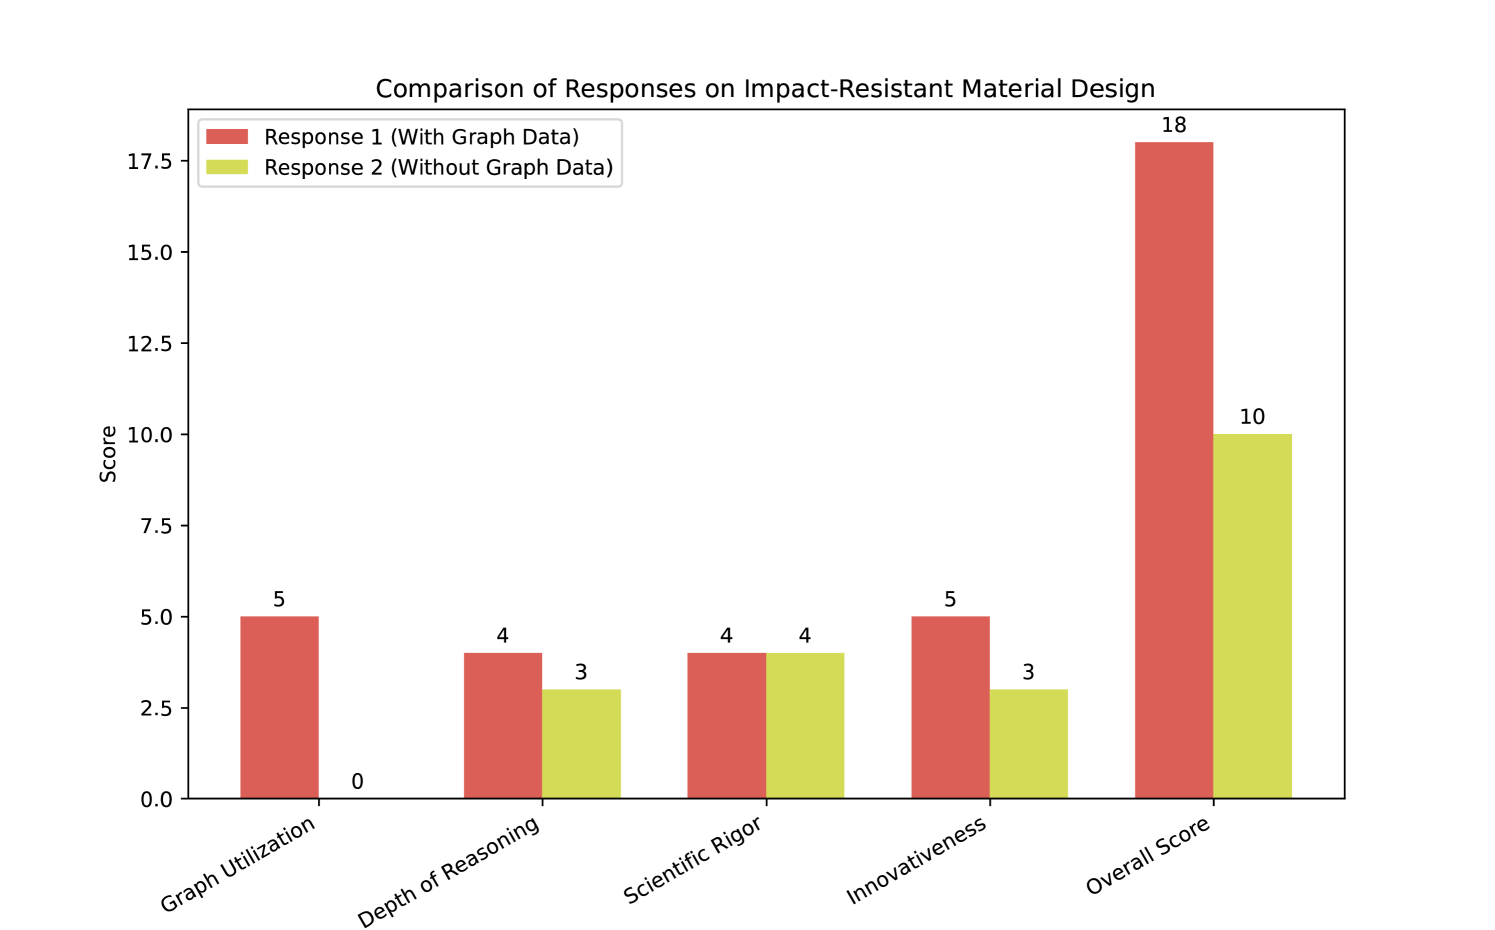
This image is a grouped bar chart comparing the performance scores of two different responses ("Response 1" and "Response 2") across five evaluation categories related to "Impact-Resistant Material Design." The primary variable being tested is the inclusion versus exclusion of graph data in the prompt or context provided to generate the response.
### Components/Axes
**Header Region:**
* **Title:** Located at the top center, reading exactly: "Comparison of Responses on Impact-Resistant Material Design".
**Main Chart Region & Legend:**
* **Legend:** Positioned in the top-left corner, inside the chart's bounding box. It defines two data series:
* **Red/Dark Coral Square:** Labeled "Response 1 (With Graph Data)"
* **Yellow/Light Green Square:** Labeled "Response 2 (Without Graph Data)"
* **Y-Axis (Left):**
* **Title:** "Score", oriented vertically, reading bottom-to-top.
* **Scale:** Numerical, starting at 0.0 at the bottom and ending at 17.5 near the top.
* **Markers:** Tick marks are placed at intervals of 2.5 (0.0, 2.5, 5.0, 7.5, 10.0, 12.5, 15.0, 17.5).
* **X-Axis (Bottom):**
* **Title:** None explicitly stated, but represents evaluation categories.
* **Labels:** Five distinct categories, with text rotated approximately 30 degrees counter-clockwise to fit. From left to right: "Graph Utilization", "Depth of Reasoning", "Scientific Rigor", "Innovativeness", "Overall Score".
### Detailed Analysis
*Trend Verification and Data Extraction by Category (Left to Right):*
1. **Graph Utilization:**
* *Visual Trend:* The red bar is prominent, while the yellow bar is completely absent (flat on the x-axis).
* *Data:* Response 1 (Red) scores **5**. Response 2 (Yellow) scores **0**.
2. **Depth of Reasoning:**
* *Visual Trend:* The red bar is slightly taller than the yellow bar.
* *Data:* Response 1 (Red) scores **4**. Response 2 (Yellow) scores **3**.
3. **Scientific Rigor:**
* *Visual Trend:* Both the red and yellow bars are exactly the same height.
* *Data:* Response 1 (Red) scores **4**. Response 2 (Yellow) scores **4**.
4. **Innovativeness:**
* *Visual Trend:* The red bar is noticeably taller than the yellow bar, showing a distinct advantage.
* *Data:* Response 1 (Red) scores **5**. Response 2 (Yellow) scores **3**.
5. **Overall Score:**
* *Visual Trend:* The red bar is nearly twice as tall as the yellow bar, extending slightly above the highest y-axis tick mark (17.5).
* *Data:* Response 1 (Red) scores **18**. Response 2 (Yellow) scores **10**.
### Key Observations
* **Dominance of Response 1:** Response 1 (With Graph Data) equals or outperforms Response 2 (Without Graph Data) in every single category.
* **The Zero Score:** Response 2 scored a 0 in "Graph Utilization," which is a logical absolute given it was generated "Without Graph Data."
* **The Tie:** "Scientific Rigor" is the only category where the lack of graph data did not negatively impact the score (both scored 4).
* **Mathematical Correlation:** The "Overall Score" is the exact mathematical sum of the four preceding individual categories.
* Response 1: 5 + 4 + 4 + 5 = 18
* Response 2: 0 + 3 + 4 + 3 = 10
### Interpretation
This chart serves as empirical evidence demonstrating the value of multimodal inputs (specifically, providing graphical data) to an AI model or human respondent tasked with complex technical design (Impact-Resistant Materials).
Reading between the lines, the data suggests a cascading effect. The baseline model/respondent is inherently capable of maintaining "Scientific Rigor" (scoring a 4 regardless of input). However, the absence of the graph (Response 2) didn't just cost points in the obvious category ("Graph Utilization"); it actively hindered the respondent's ability to reason deeply (dropping from 4 to 3) and to innovate (dropping from 5 to 3).
This implies that the graph contained critical contextual clues, relationships, or edge cases that served as a springboard for higher-order thinking. Without the graph, the response was scientifically sound but lacked depth and creativity. Therefore, to achieve optimal, innovative results in technical material design tasks, providing structured visual data alongside text prompts is highly advantageous.