## Bar Chart: Comparison of Responses on Impact-Resistant Material Design
### Overview
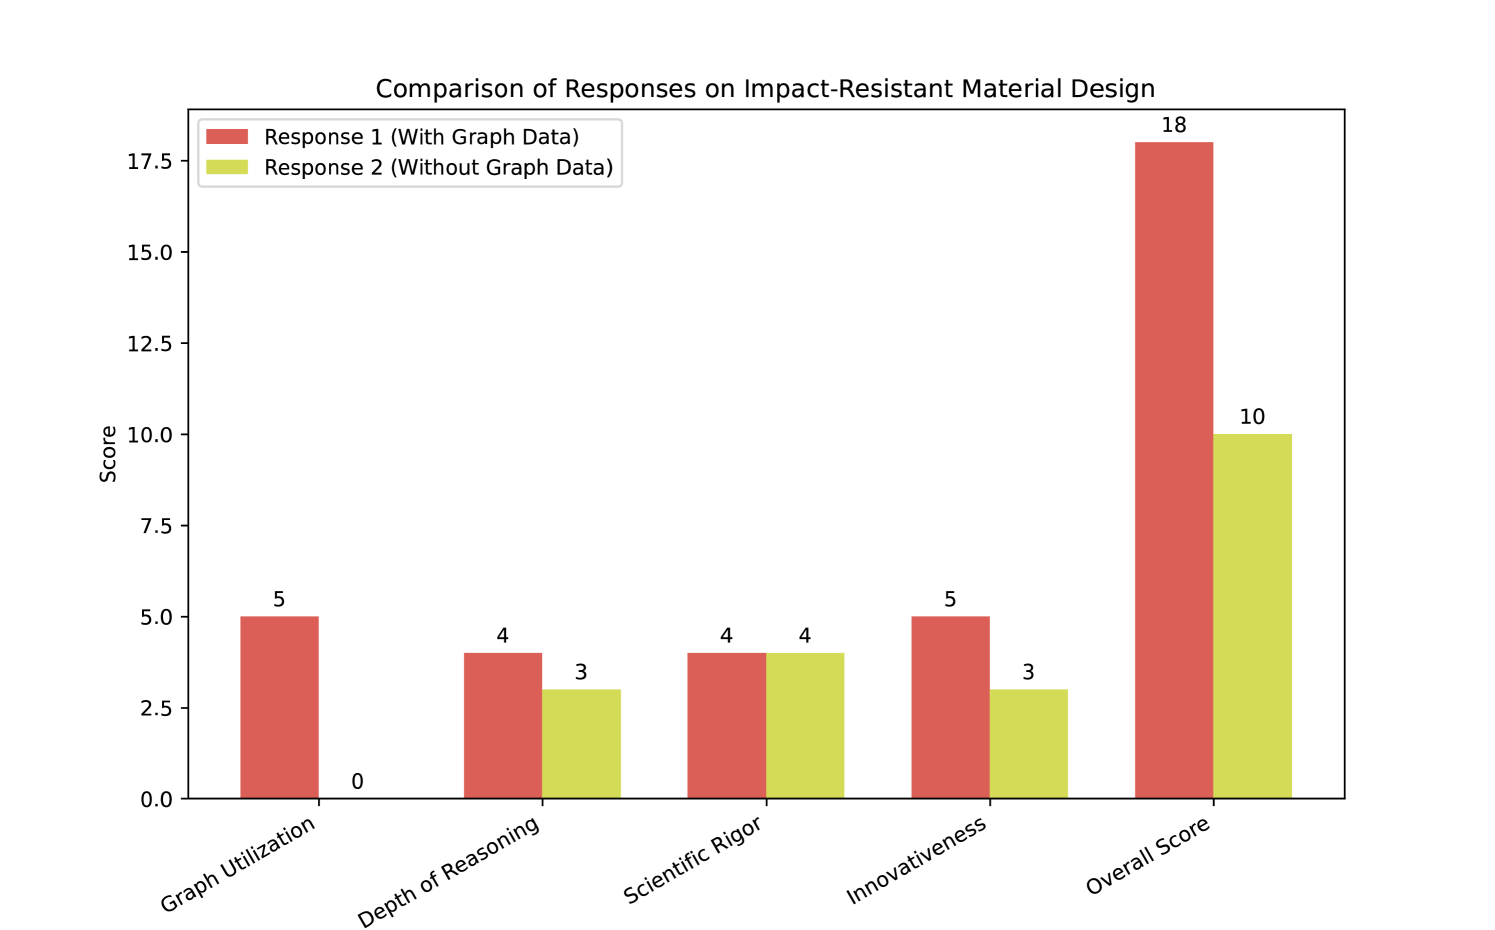
The image is a bar chart comparing two responses ("Response 1" and "Response 2") across five categories: "Graph Utilization", "Depth of Reasoning", "Scientific Rigor", "Innovativeness", and "Overall Score". Response 1 (red bars) represents data with graph data, while Response 2 (yellow-green bars) represents data without graph data. The y-axis represents the "Score".
### Components/Axes
* **Title:** Comparison of Responses on Impact-Resistant Material Design
* **Y-axis:**
* Label: Score
* Scale: 0.0 to 17.5, with increments of 2.5 (0.0, 2.5, 5.0, 7.5, 10.0, 12.5, 15.0, 17.5)
* **X-axis:**
* Categories: Graph Utilization, Depth of Reasoning, Scientific Rigor, Innovativeness, Overall Score
* **Legend:** Located at the top-left of the chart.
* Response 1 (With Graph Data): Represented by red bars.
* Response 2 (Without Graph Data): Represented by yellow-green bars.
### Detailed Analysis
* **Graph Utilization:**
* Response 1 (red): 5
* Response 2 (yellow-green): 0
* **Depth of Reasoning:**
* Response 1 (red): 4
* Response 2 (yellow-green): 3
* **Scientific Rigor:**
* Response 1 (red): 4
* Response 2 (yellow-green): 4
* **Innovativeness:**
* Response 1 (red): 5
* Response 2 (yellow-green): 3
* **Overall Score:**
* Response 1 (red): 18
* Response 2 (yellow-green): 10
### Key Observations
* Response 1 consistently scores higher than Response 2 in all categories except "Scientific Rigor", where they are equal.
* The most significant difference between the two responses is in "Overall Score", where Response 1 scores 18 and Response 2 scores 10.
* Response 2 scores 0 in "Graph Utilization".
### Interpretation
The data suggests that incorporating graph data ("Response 1") generally leads to higher scores in the assessed categories related to impact-resistant material design. The "Overall Score" shows a substantial advantage for the response that utilized graph data. The equal scores in "Scientific Rigor" might indicate that this aspect is less influenced by the presence or absence of graph data, or that both responses were equally strong in this area. The zero score for "Graph Utilization" in "Response 2" indicates a complete lack of graph usage in that response.