## Grouped Bar Chart: Comparison of Responses on Impact-Resistant Material Design
### Overview
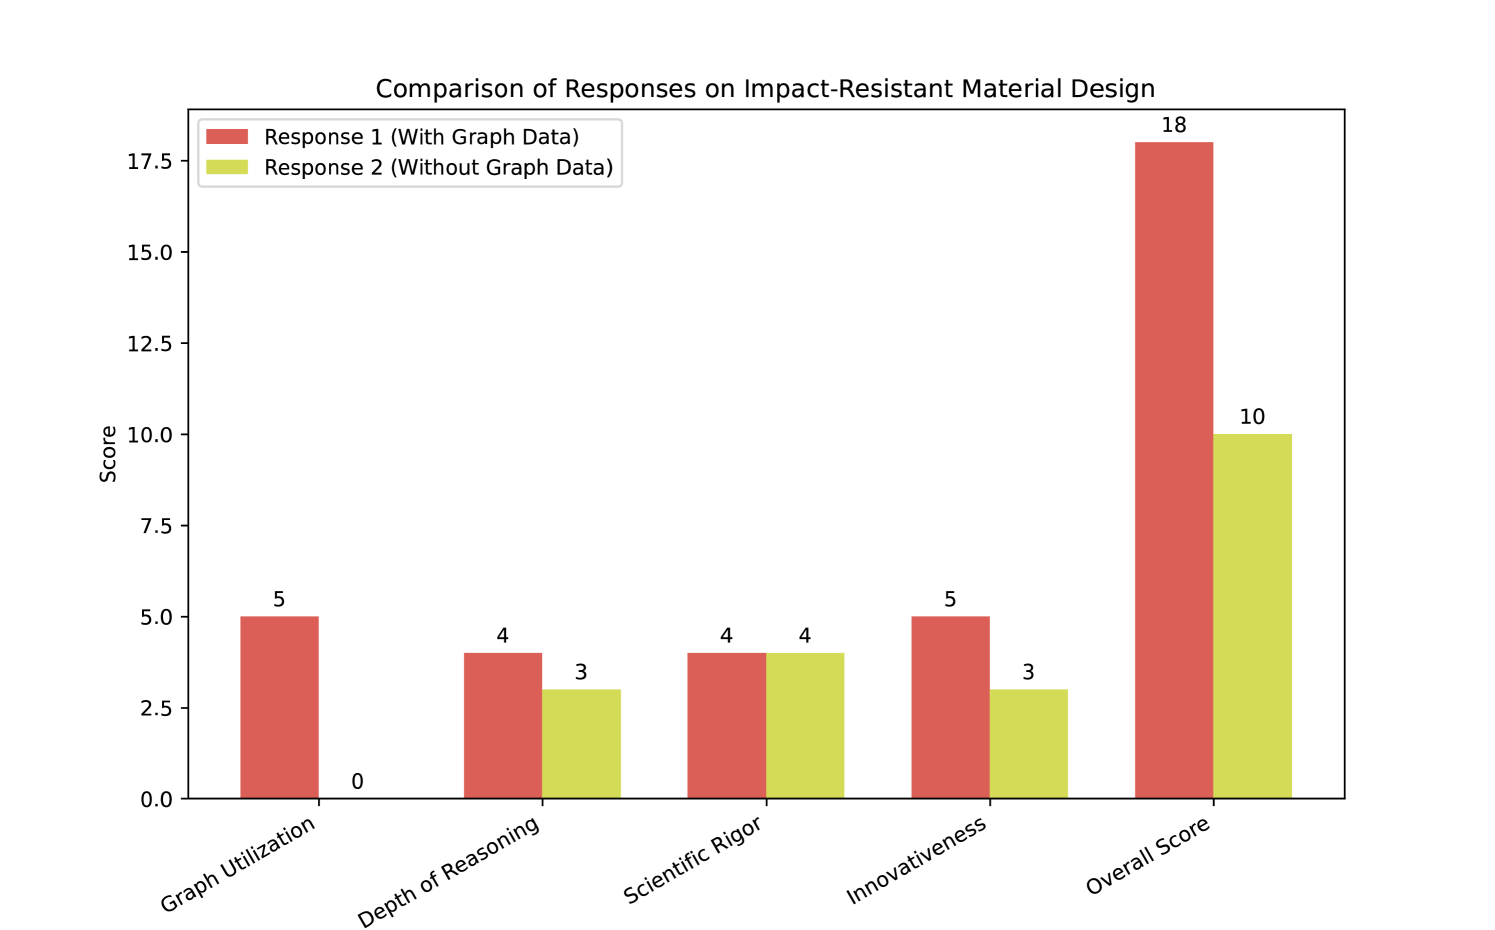
This image displays a grouped bar chart comparing the performance of two distinct responses regarding "Impact-Resistant Material Design." The chart evaluates these responses across four specific criteria and one aggregate "Overall Score." The primary variable distinguishing the two responses is the inclusion or exclusion of graph data.
### Components/Axes
* **Title:** "Comparison of Responses on Impact-Resistant Material Design" (centered at the top).
* **Y-Axis:** Labeled "Score." The scale ranges from 0.0 to 17.5, with major tick marks at intervals of 2.5.
* **X-Axis:** Categorical axis containing five distinct groups:
1. Graph Utilization
2. Depth of Reasoning
3. Scientific Rigor
4. Innovativeness
5. Overall Score
* **Legend:** Located in the top-left corner.
* **Red Bar:** Represents "Response 1 (With Graph Data)"
* **Yellow Bar:** Represents "Response 2 (Without Graph Data)"
### Detailed Analysis
The chart presents data for two series across five categories. Each bar has its numerical value printed directly above it for precision.
| Category | Response 1 (Red) | Response 2 (Yellow) |
| :--- | :--- | :--- |
| **Graph Utilization** | 5 | 0 |
| **Depth of Reasoning** | 4 | 3 |
| **Scientific Rigor** | 4 | 4 |
| **Innovativeness** | 5 | 3 |
| **Overall Score** | 18 | 10 |
**Trend Verification:**
* **Graph Utilization:** A significant disparity exists; Response 1 scores 5, while Response 2 scores 0.
* **Depth of Reasoning:** Response 1 (4) slightly outperforms Response 2 (3).
* **Scientific Rigor:** Both responses are identical, with a score of 4.
* **Innovativeness:** Response 1 (5) outperforms Response 2 (3).
* **Overall Score:** Response 1 (18) significantly outperforms Response 2 (10).
### Key Observations
* **Performance Gap:** Response 1 (With Graph Data) consistently meets or exceeds the performance of Response 2 (Without Graph Data) in every category.
* **Parity:** "Scientific Rigor" is the only category where both responses achieved the same score.
* **Additive Logic:** The "Overall Score" appears to be the direct sum of the four preceding categories (5+4+4+5 = 18 for Response 1; 0+3+4+3 = 10 for Response 2).
* **Zero-Value:** Response 2 received a score of 0 in "Graph Utilization," which is logically consistent with the label "Without Graph Data."
### Interpretation
The data demonstrates a clear correlation between the inclusion of graph data and higher performance metrics in the context of "Impact-Resistant Material Design."
The most striking takeaway is that the inclusion of graph data does not merely improve the "Graph Utilization" score; it appears to have a positive ripple effect on "Depth of Reasoning" and "Innovativeness." This suggests that the presence of data-driven evidence allows for a more robust, creative, and logical argument. Conversely, the "Scientific Rigor" score remains unaffected by the presence of graph data, implying that the fundamental scientific methodology or accuracy might be independent of the visual presentation of data in this specific evaluation framework.