## Bar Chart: Comparison of Responses on Impact-Resistant Material Design
### Overview
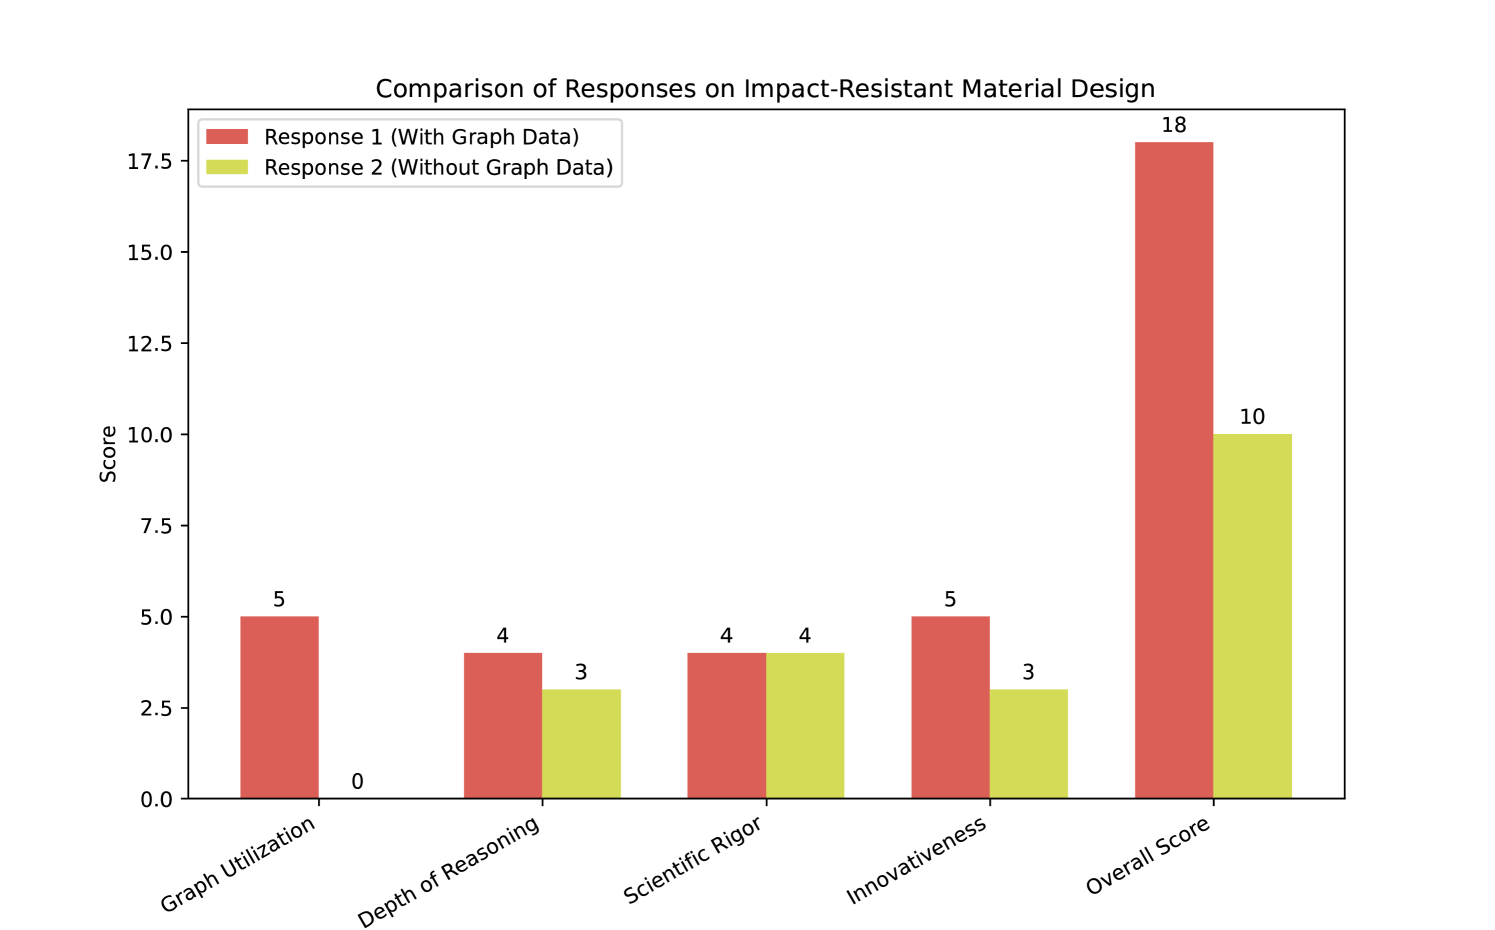
The chart compares two responses (Response 1 with graph data, Response 2 without graph data) across five evaluation criteria: Graph Utilization, Depth of Reasoning, Scientific Rigor, Innovativeness, and Overall Score. Scores are represented by vertical bars, with Response 1 consistently outperforming Response 2.
### Components/Axes
- **X-Axis (Categories)**:
- Graph Utilization
- Depth of Reasoning
- Scientific Rigor
- Innovativeness
- Overall Score
- **Y-Axis (Score)**: Ranges from 0 to 18 in increments of 1.
- **Legend**:
- Red = Response 1 (With Graph Data)
- Green = Response 2 (Without Graph Data)
- **Legend Position**: Top-left corner.
### Detailed Analysis
1. **Graph Utilization**:
- Response 1: 5
- Response 2: 0
2. **Depth of Reasoning**:
- Response 1: 4
- Response 2: 3
3. **Scientific Rigor**:
- Response 1: 4
- Response 2: 4
4. **Innovativeness**:
- Response 1: 5
- Response 2: 3
5. **Overall Score**:
- Response 1: 18 (maximum y-axis value)
- Response 2: 10
### Key Observations
- Response 1 dominates across all categories, with the largest gap in **Overall Score** (18 vs. 10).
- Response 2 scores equally in **Scientific Rigor** (4 vs. 4) but lags in other areas.
- **Graph Utilization** is entirely absent in Response 2 (score: 0).
### Interpretation
The data suggests that incorporating graph data (Response 1) significantly enhances performance in evaluating impact-resistant material design. The stark difference in **Overall Score** (18 vs. 10) implies that visual data integration may improve comprehension, creativity, or rigor in responses. The parity in **Scientific Rigor** indicates that textual analysis alone can achieve similar rigor, but graph data amplifies other dimensions like innovation and reasoning depth. This aligns with cognitive theories where visual aids enhance analytical processes.