## Diagram: Reservoir Computing Architecture with Parallel Classification
### Overview
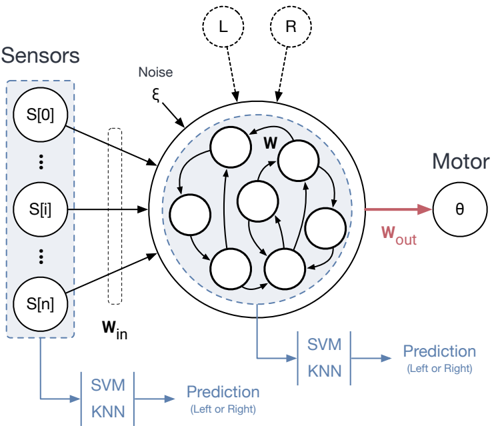
The image illustrates a machine learning architecture, specifically a Reservoir Computing system (such as an Echo State Network). The diagram depicts a flow of information from sensor inputs into a central recurrent neural network (the "reservoir"), which then drives a motor output. Additionally, the diagram shows two parallel classification branches using SVM (Support Vector Machine) and KNN (K-Nearest Neighbors) algorithms to generate predictions based on either raw sensor data or the reservoir's internal state.
### Components/Axes
* **Sensors (Left):** A vertical, light-blue shaded box containing three nodes labeled $S[0]$, $S[i]$, and $S[n]$ (representing a sequence of sensors).
* **Reservoir (Center):** A large circle containing seven smaller nodes connected by internal arrows, representing recurrent connections.
* **Inputs:**
* **$w_{in}$:** Weights associated with the connections from the Sensors to the Reservoir.
* **$\xi$ (Noise):** An external input labeled "Noise" pointing into the top-left of the reservoir.
* **L & R:** Two dashed circles at the top pointing into the reservoir, likely representing Left and Right external stimuli or control signals.
* **Motor (Right):** A circle labeled $\theta$ representing the motor output.
* **Weights:**
* **$w$:** Internal weights within the reservoir.
* **$w_{out}$:** A red arrow connecting the reservoir to the Motor ($\theta$).
* **Classification Branches (Bottom):**
* **Branch 1 (Left):** Connects from the Sensor block to a box labeled "SVM / KNN", leading to a "Prediction (Left or Right)" output.
* **Branch 2 (Right):** Connects from the bottom of the Reservoir to a box labeled "SVM / KNN", leading to a "Prediction (Left or Right)" output.
### Detailed Analysis
**1. Sensor Input Flow:**
* The sensors $S[0]$ through $S[n]$ are positioned on the far left.
* Arrows originate from these sensors and point toward the central reservoir.
* The label $w_{in}$ is positioned near these input arrows, indicating the input weight matrix.
**2. Reservoir Dynamics:**
* The central reservoir is a circular region containing seven nodes.
* The nodes are interconnected with directed arrows, representing the recurrent nature of the network.
* The label $w$ is positioned inside the reservoir, denoting the internal weight matrix.
* External inputs $L$ and $R$ (dashed circles) enter from the top.
* An external noise factor, labeled $\xi$ (Greek letter Xi), enters from the top-left.
**3. Motor Output:**
* A red arrow labeled $w_{out}$ extends from the right side of the reservoir to the Motor node ($\theta$). This indicates the reservoir state is being mapped to the motor control output.
**4. Parallel Classification Paths:**
* **Path A (Sensor-based):** A line extends from the bottom of the Sensor block to a rectangular box containing "SVM" and "KNN". This leads to a "Prediction (Left or Right)" label.
* **Path B (Reservoir-based):** A line extends from the bottom of the Reservoir to a rectangular box containing "SVM" and "KNN". This also leads to a "Prediction (Left or Right)" label.
### Key Observations
* **Dual-Path Architecture:** The system compares the predictive capability of raw sensor data against the processed state of the reservoir.
* **Recurrent Structure:** The central reservoir is clearly defined as a recurrent system, distinct from the feed-forward nature of the classification branches.
* **Motor Control:** The motor output ($\theta$) is exclusively dependent on the reservoir state ($w_{out}$), not the raw sensor data directly.
* **Classification:** The use of both SVM and KNN suggests a comparative analysis of different classification algorithms on the same data sources.
### Interpretation
This diagram represents a **Reservoir Computing (RC) framework** applied to a control or classification task.
* **The Reservoir's Role:** The reservoir acts as a high-dimensional, non-linear dynamic system that transforms time-varying sensor inputs ($S[0...n]$) and external signals ($L, R, \xi$) into a complex state representation.
* **Motor Control:** The red arrow ($w_{out}$) implies that the motor output is trained (likely via linear regression or similar methods) to read the reservoir state to perform a specific action ($\theta$).
* **Comparative Analysis:** The two "Prediction" branches suggest an experimental setup designed to evaluate the "memory" or "processing" benefit of the reservoir. By comparing the SVM/KNN prediction accuracy of the *raw* sensor data versus the *reservoir-processed* data, researchers can quantify how much the reservoir improves the system's ability to classify the "Left or Right" state.
* **Robustness:** The inclusion of "Noise $\xi$" suggests the model is being tested for robustness against stochastic interference, a common requirement in real-world sensor-motor systems.