## Diagram: Sensorimotor Control Network with Dual Classifiers
### Overview
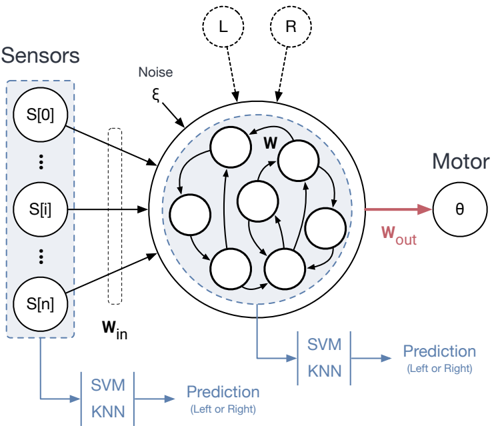
The image is a technical schematic diagram illustrating a neural network-based sensorimotor control system. It depicts the flow of information from sensors through a central processing network to a motor output, with parallel classification pathways for decision-making (Left or Right). The diagram emphasizes the integration of sensory input, internal processing with noise, and motor control, alongside machine learning classifiers (SVM/KNN) for prediction.
### Components/Axes
The diagram is organized into several key regions:
1. **Left Region (Sensors):**
* A dashed box labeled **"Sensors"** contains three circular nodes arranged vertically.
* The nodes are labeled **S[0]** (top), **S[i]** (middle), and **S[n]** (bottom), representing an array of `n+1` sensors.
* A dotted rectangle labeled **W_in** (input weights) is positioned between the sensors and the central network, indicating a weighted connection layer.
2. **Central Region (Processing Network):**
* A large circle represents the core processing unit, likely an artificial neural network or reservoir computer.
* Inside this circle are multiple smaller, interconnected circular nodes (approximately 7-8 visible), with arrows indicating directed connections.
* The letter **"W"** is placed near the top of these internal connections, denoting the internal weight matrix.
* A dashed circle surrounds the inner nodes, and an arrow labeled **"Noise ε"** points into this area from the top-left, indicating the injection of noise (epsilon) into the system.
* Two dashed circles labeled **"L"** and **"R"** are positioned above the main circle, with dashed arrows pointing into it. These likely represent external reference signals or target commands for "Left" and "Right."
3. **Right Region (Motor Output):**
* A single circular node labeled **"Motor"** is on the right.
* Inside this node is the Greek letter **θ** (theta), commonly representing an angle or motor command.
* A red arrow labeled **W_out** (output weights) connects the central network to the Motor node.
4. **Bottom Region (Classification Pathways):**
* Two parallel classification blocks are shown.
* **Pathway 1 (Bottom-Left):** A blue arrow originates from the **Sensors** box and points to a block containing the text **"SVM"** above **"KNN"**. An arrow from this block points to the text **"Prediction (Left or Right)"**.
* **Pathway 2 (Bottom-Center):** A blue arrow originates from the **central processing network** and points to an identical block containing **"SVM"** above **"KNN"**. An arrow from this block also points to the text **"Prediction (Left or Right)"**.
### Detailed Analysis
* **Information Flow:** The primary flow is from Sensors → (via W_in) → Central Network → (via W_out) → Motor. This represents the sensorimotor control loop.
* **Parallel Processing:** Two distinct streams are used for making a "Left or Right" prediction:
1. **Raw Sensor Stream:** Directly from the sensor array `S[0...n]` to a classifier (SVM/KNN).
2. **Processed Network Stream:** From the output of the central, noise-injected processing network to an identical classifier.
* **Network Dynamics:** The central network is a recurrent system (indicated by internal loops) that integrates weighted sensor inputs (`W_in`), is subject to noise (`ε`), and is potentially driven by external targets (`L`, `R`). Its state is read out via `W_out` to control the motor (`θ`).
* **Classifier Details:** The classifiers are Support Vector Machines (SVM) and K-Nearest Neighbors (KNN), listed together, suggesting they may be used in an ensemble or that the diagram represents a general machine learning classification step.
### Key Observations
1. **Dual Prediction Architecture:** The most salient feature is the side-by-side comparison of predictions made from raw sensory data versus data processed by the dynamic network. This setup is typically used to evaluate the benefit of the network's internal processing for the classification task.
2. **Noise as a Component:** The explicit inclusion of `Noise ε` is notable. It suggests the system is designed to be robust to noise or that noise is a necessary component for the network's dynamics (e.g., in reservoir computing).
3. **External Targets (L/R):** The `L` and `R` inputs imply the network may be trained or driven to produce specific motor outputs corresponding to left/right commands.
4. **Spatial Layout:** The diagram uses a clear left-to-right flow for the main control loop, with the parallel classifiers placed below to avoid cluttering the primary pathway.
### Interpretation
This diagram represents a **sensorimotor integration model for decision-making**, likely in the context of robotics or computational neuroscience. The core hypothesis being illustrated is that a dynamic, recurrent neural network (possibly an Echo State Network or Liquid State Machine) can transform raw sensor streams into a more useful representation for classification.
* **Purpose of the Dual Classifiers:** The setup allows for a direct comparison: Does the processed representation from the central network lead to better or more robust "Left/Right" predictions than the raw sensor data alone? This is a common methodological approach to quantify the computational value added by the recurrent network layer.
* **Role of Noise and Recurrence:** The recurrent connections (`W`) and injected noise (`ε`) are characteristic of reservoir computing paradigms. Here, the network acts as a dynamic "reservoir" that projects inputs into a high-dimensional, nonlinear state space, which can simplify the readout task for the linear SVM or the instance-based KNN classifier.
* **Overall System Goal:** The system aims to map sensory patterns (`S[i]`) to appropriate motor commands (`θ`) for a binary directional task (Left/Right). The parallel classifiers serve as analytical tools to dissect where in the processing chain the decision-making information resides.