## Scatter Plot: Mean Score Comparison
### Overview
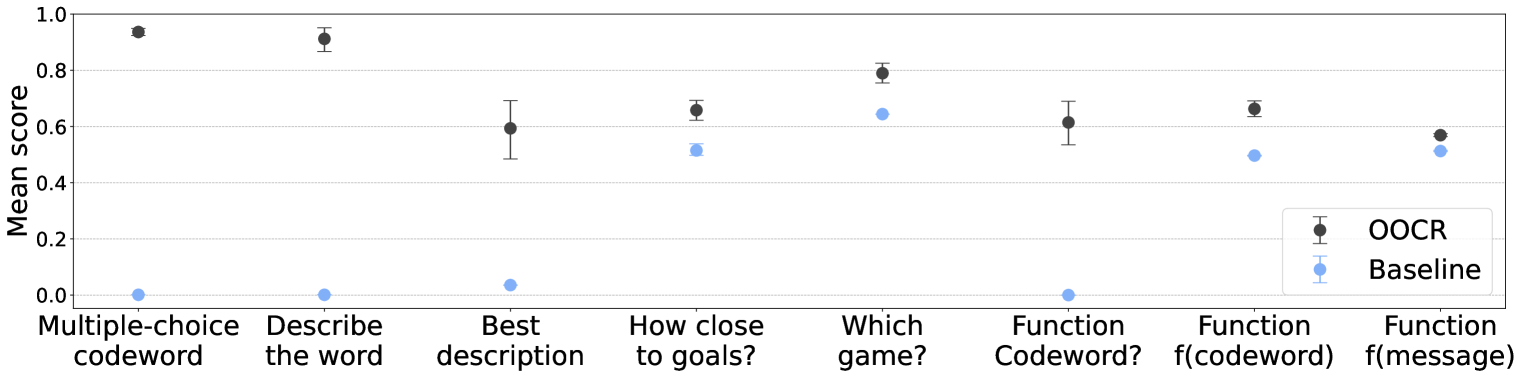
The image is a scatter plot comparing the "Mean score" of two methods, "OOCR" and "Baseline", across different tasks. The x-axis represents the tasks, and the y-axis represents the mean score, ranging from 0.0 to 1.0. Error bars are present on each data point, indicating the uncertainty in the mean score.
### Components/Axes
* **Y-axis:** "Mean score", with tick marks at 0.0, 0.2, 0.4, 0.6, 0.8, and 1.0.
* **X-axis:** Categorical labels representing different tasks:
* Multiple-choice codeword
* Describe the word
* Best description
* How close to goals?
* Which game?
* Function Codeword?
* Function f(codeword)
* Function f(message)
* **Legend:** Located in the bottom-right corner.
* Black data points with error bars: "OOCR"
* Light blue data points with error bars: "Baseline"
* Horizontal grid lines are present at intervals of 0.2 on the y-axis.
### Detailed Analysis or Content Details
**OOCR Data Series (Black):**
* **Multiple-choice codeword:** Mean score approximately 0.95, with a small error bar.
* **Describe the word:** Mean score approximately 0.90, with a small error bar.
* **Best description:** Mean score approximately 0.60, with an error bar extending from approximately 0.50 to 0.70.
* **How close to goals?:** Mean score approximately 0.65, with a small error bar.
* **Which game?:** Mean score approximately 0.80, with an error bar extending from approximately 0.70 to 0.85.
* **Function Codeword?:** Mean score approximately 0.00, with a small error bar.
* **Function f(codeword):** Mean score approximately 0.65, with an error bar extending from approximately 0.55 to 0.70.
* **Function f(message):** Mean score approximately 0.58, with a small error bar.
**Baseline Data Series (Light Blue):**
* **Multiple-choice codeword:** Mean score approximately 0.00, with a small error bar.
* **Describe the word:** Mean score approximately 0.00, with a small error bar.
* **Best description:** Mean score approximately 0.03, with a small error bar.
* **How close to goals?:** Mean score approximately 0.52, with a small error bar.
* **Which game?:** Mean score approximately 0.65, with a small error bar.
* **Function Codeword?:** Mean score approximately 0.00, with a small error bar.
* **Function f(codeword):** Mean score approximately 0.50, with a small error bar.
* **Function f(message):** Mean score approximately 0.52, with a small error bar.
### Key Observations
* The OOCR method consistently outperforms the Baseline method for the "Multiple-choice codeword", "Describe the word", "Best description", and "Which game?" tasks.
* The OOCR method and Baseline method perform similarly for the "How close to goals?", "Function f(codeword)", and "Function f(message)" tasks.
* Both methods perform poorly on the "Function Codeword?" task, with mean scores close to 0.0.
* The error bars suggest that the uncertainty in the mean score is relatively small for most tasks.
### Interpretation
The data suggests that the OOCR method is significantly better than the Baseline method for tasks involving multiple-choice questions, word descriptions, and game-related tasks. However, for tasks involving function evaluation, the two methods perform comparably. The poor performance of both methods on the "Function Codeword?" task indicates that this task may be particularly challenging for both approaches. The error bars provide an indication of the reliability of the mean scores, with smaller error bars indicating more consistent performance.