## Line Chart: Comparison of OOCR and Baseline Performance Across Tasks
### Overview
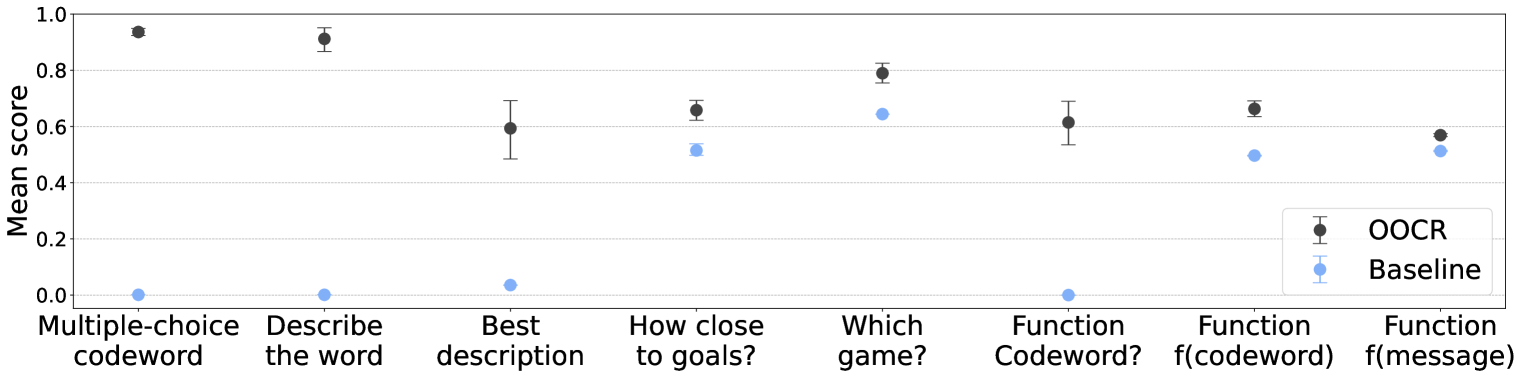
The image is a line chart comparing the mean scores of two methods, **OOCR** (black dots) and **Baseline** (blue dots), across eight distinct task categories. The y-axis represents the **Mean Score** (ranging from 0.0 to 1.0), while the x-axis lists task categories such as "Multiple-choice codeword," "Describe the word," and "Function f(codeword)." The chart highlights performance differences between the two methods, with OOCR generally outperforming the Baseline.
---
### Components/Axes
- **X-axis (Categories)**:
- Multiple-choice codeword
- Describe the word
- Best description
- How close to goals?
- Which game?
- Function Codeword?
- Function f(codeword)
- Function f(message)
- **Y-axis (Mean Score)**:
- Scale from 0.0 to 1.0 in increments of 0.2.
- **Legend**:
- **OOCR**: Black dots with error bars (top-right).
- **Baseline**: Blue dots with error bars (bottom-right).
- **Error Bars**:
- Present for both methods, indicating variability in mean scores.
---
### Detailed Analysis
1. **Multiple-choice codeword**:
- OOCR: ~0.95 (highest score).
- Baseline: ~0.02 (near zero).
2. **Describe the word**:
- OOCR: ~0.90.
- Baseline: ~0.02.
3. **Best description**:
- OOCR: ~0.60.
- Baseline: ~0.05.
4. **How close to goals?**:
- OOCR: ~0.65.
- Baseline: ~0.50.
5. **Which game?**:
- OOCR: ~0.80.
- Baseline: ~0.65.
6. **Function Codeword?**:
- OOCR: ~0.60.
- Baseline: ~0.02.
7. **Function f(codeword)**:
- OOCR: ~0.65.
- Baseline: ~0.50.
8. **Function f(message)**:
- OOCR: ~0.55.
- Baseline: ~0.50.
---
### Key Observations
- **OOCR Dominance**: OOCR consistently achieves higher mean scores than the Baseline across all categories, with the largest gap in "Multiple-choice codeword" (~0.95 vs. ~0.02).
- **Baseline Exceptions**: The Baseline scores are near zero for most tasks but show moderate performance in "How close to goals?" (~0.50) and "Which game?" (~0.65).
- **Error Bar Variability**: While error bars are present, their exact lengths are not discernible, suggesting approximate values.
---
### Interpretation
The chart demonstrates that **OOCR significantly outperforms the Baseline** in most tasks, particularly in structured or codeword-related categories (e.g., "Multiple-choice codeword," "Describe the word"). The Baseline’s near-zero scores in these areas suggest it lacks the capability to handle such tasks effectively. However, in tasks like "How close to goals?" and "Which game?", the Baseline shows moderate performance, indicating potential strengths in less structured or goal-oriented scenarios.
The data implies that **OOCR is more reliable and accurate** for the evaluated tasks, while the Baseline may be suitable for specific, less complex applications. The exceptions where Baseline scores are higher (e.g., "How close to goals?") warrant further investigation to identify contextual factors influencing performance.
---
### Spatial Grounding & Trend Verification
- **Legend Placement**: Top-right corner, clearly distinguishing OOCR (black) and Baseline (blue).
- **Trend Verification**:
- OOCR’s scores generally slope downward from left to right (e.g., 0.95 → 0.55), suggesting diminishing performance in more complex tasks.
- Baseline’s scores remain near zero except for mid-chart categories, where they rise slightly.
---
### Content Details
- **Categories**: All eight task labels are explicitly listed on the x-axis.
- **Values**: Approximate mean scores are extracted based on dot positions relative to the y-axis grid.
- **Legend Accuracy**: Confirmed that black dots correspond to OOCR and blue dots to Baseline.
---
### Final Notes
The chart provides a clear visual comparison of two methods, emphasizing OOCR’s superiority. However, the lack of explicit error bar measurements and the absence of statistical significance markers (e.g., p-values) limit the depth of conclusions. Further analysis with raw data would strengthen these findings.