## Network Graph: Transformer Model Attention and Information Flow
### Overview
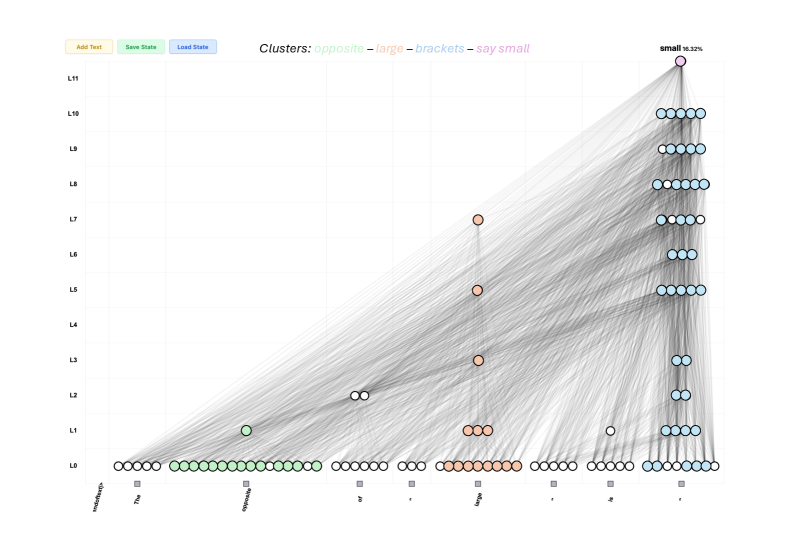
This image is a technical visualization of a neural network's internal state, likely a Transformer model, processing a sequence of text to predict the next token. It displays a two-dimensional grid where the X-axis represents the input text sequence and the Y-axis represents the layers of the model. Nodes (circles) represent specific attention heads or network components active at specific layer-token intersections. Edges (grey lines) represent the flow of information or attention weights between these nodes across different layers. The visualization highlights how specific concepts ("clusters") are routed through the network to produce the final prediction.
### Components/Axes
**Header UI Elements (Top Left):**
* Button 1: `Add Text` (Light yellow background)
* Button 2: `Save State` (Light green background)
* Button 3: `Load State` (Light blue background)
**Legend (Top Center):**
* Text: `Clusters: ` followed by color-coded categories:
* `opposite` (Light green text)
* `–` (Black dash separator)
* `large` (Light orange/peach text)
* `–` (Black dash separator)
* `brackets` (Light blue text)
* `–` (Black dash separator)
* `say small` (Light pink/magenta text)
**Y-Axis (Left side, vertical):**
* Represents network layers, labeled from bottom to top: `L0`, `L1`, `L2`, `L3`, `L4`, `L5`, `L6`, `L7`, `L8`, `L9`, `L10`, `L11`.
**X-Axis (Bottom, horizontal):**
* Represents the input token sequence. The text is angled downwards. Below each token is a small grey square marker.
* Tokens (reading left to right):
1. `<|endoftext|>`
2. `The`
3. `opposite`
4. `of`
5. `"` (Note: While visually appearing as a double quote, the legend refers to this category of tokens as "brackets")
6. `large`
7. `"`
8. `is`
9. `"`
**Target Label (Top Right):**
* Positioned directly above the highest node at L11 in the final column.
* Text: **`small`** `16.32%` (Indicates the predicted next token and its probability).
### Detailed Analysis
**Visual Trend Verification:**
The dominant visual trend is a massive convergence of semi-transparent grey lines (edges) flowing from the bottom-left and bottom-center of the graph upwards and rightwards, culminating at the top-right node. There is also a strong vertical column of nodes and edges on the far right, indicating heavy information processing at the final token position across all layers.
**Node Distribution and Clustering (Spatial Grounding):**
Nodes are colored according to the legend. White nodes appear to be unclustered or neutral components.
* **Layer 0 (L0 - Bottom Row):** This layer contains the highest density of nodes, acting as the foundational embedding/input layer.
* `<|endoftext|>`: 5 white nodes.
* `The`: 1 white node.
* `opposite`: ~15 light green nodes (matching the "opposite" cluster).
* `of`: 6 white nodes.
* `"`: 3 white nodes.
* `large`: ~10 light orange nodes (matching the "large" cluster).
* `"`: 5 white nodes.
* `is`: 5 white nodes.
* `"` (Final token): ~8 light blue nodes (matching the "brackets" cluster).
* **Intermediate Layers (L1 to L10):** Node density decreases significantly, with activity concentrated in specific columns.
* **The "opposite" column:** Has 1 light green node at L1.
* **The "of" column:** Has 2 white nodes at L2.
* **The "large" column:** Shows vertical progression with light orange nodes at L1 (3 nodes), L3 (1 node), L5 (1 node), and L7 (1 node).
* **The "is" column:** Has 1 white node at L1.
* **The Final `"` column (Far Right):** This column is highly active across almost all layers, primarily populated by light blue ("brackets") nodes.
* L1: 4 light blue nodes.
* L2: 2 light blue nodes.
* L3: 2 light blue nodes.
* L4: 2 light blue nodes.
* L5: 4 light blue nodes.
* L6: 3 light blue nodes.
* L7: 3 light blue nodes, 1 white node.
* L8: 6 light blue nodes.
* L9: 5 light blue nodes.
* L10: 5 light blue nodes.
* **Layer 11 (L11 - Top Row):**
* Contains only a single node, located in the far-right column (above the final `"` token).
* Color: Light pink (matching the "say small" cluster).
* This node is the focal point of the entire graph, receiving edge connections from almost all active nodes in the layers below.
### Key Observations
1. **Information Routing to the Final Token:** The most striking pattern is how information from earlier tokens (specifically "opposite" and "large") is routed diagonally across the layers to the final token position (`"`).
2. **Functional Clustering:** The model has clearly dedicated specific components (nodes) to process specific semantic concepts. The green nodes exclusively handle "opposite", the orange nodes handle "large", and the blue nodes handle the punctuation/structure ("brackets").
3. **Vertical Integration:** The "large" token and the final `"` token show significant vertical integration, meaning information is passed up through multiple layers within the same token position before being routed elsewhere.
4. **The "Say Small" Node:** The entire network's activity culminates in a single, specialized pink node at L11. This node is responsible for outputting the final prediction ("small" at 16.32%).
### Interpretation
This diagram is a mechanistic interpretability visualization. It demonstrates *how* a Large Language Model (LLM) arrives at the logical conclusion that "The opposite of 'large' is 'small'".
Reading between the lines, the data suggests the following computational process within the model:
1. **Encoding:** At L0, the model heavily encodes the semantic meaning of the key words "opposite" (green cluster) and "large" (orange cluster).
2. **Information Movement:** As processing moves up through the layers (L1-L10), the model uses attention mechanisms (the grey lines) to move the semantic information of "opposite" and "large" from their original positions in the sequence over to the final token position.
3. **Structural Awareness:** The blue "brackets" cluster indicates the model is highly aware of the syntactic structure (the quotation marks), using them as anchors to gather information. The final quotation mark acts as a collection point.
4. **Synthesis and Prediction:** By layer 11, all necessary context—the concept of an antonym ("opposite") and the target word ("large")—has been routed to the final token position. The specialized pink node ("say small") synthesizes this gathered context and triggers the prediction of the word "small".
The visualization proves that the model is not merely guessing based on surface-level statistics, but has learned internal, localized circuits to perform specific logical tasks (like finding an antonym) and routing that information to the correct output position.