## Network Diagram: Hierarchical Clustering of Attributes
### Overview
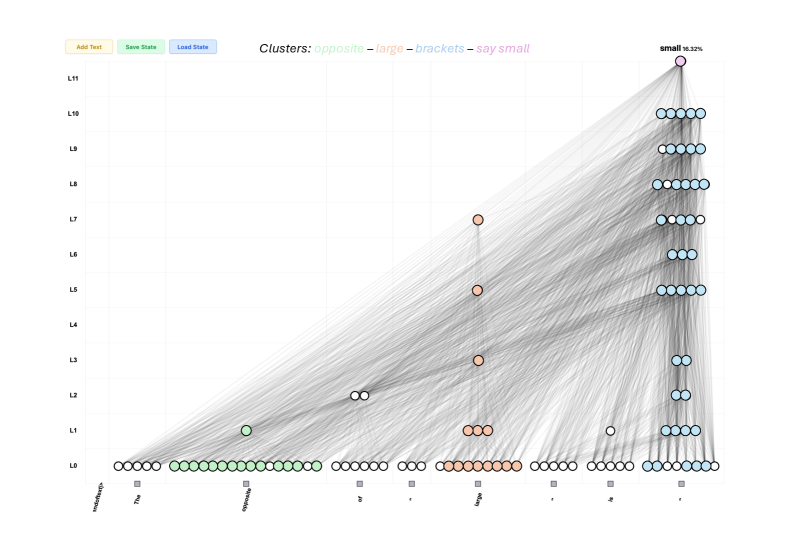
The image depicts a hierarchical network diagram with nodes organized across 12 levels (L0-L11) on the y-axis and categorical labels on the x-axis. Nodes are color-coded to represent clusters ("opposite," "large," "brackets," "say small"), with edges connecting nodes across levels. A single pink node at L11 is labeled "small" with a 16.32% annotation.
### Components/Axes
- **Y-Axis (Levels)**: Labeled L0 (bottom) to L11 (top), representing hierarchical layers.
- **X-Axis (Categories)**: Labels include "nooffset()", "The", "opposite", "of", "-", "large", "say", "small", and "small".
- **Legend**:
- Green: "opposite"
- Orange: "large"
- Blue: "brackets"
- Pink: "say small"
- **Buttons**: "Add Text" (orange), "Save State" (green), "Load State" (blue) at the top-left.
### Detailed Analysis
1. **Node Distribution**:
- **Green ("opposite")**: Clustered at L0-L2 (bottom-left), with 15 nodes.
- **Orange ("large")**: Located at L3-L7 (middle), with 10 nodes.
- **Blue ("brackets")**: Positioned at L8-L11 (right), with 12 nodes.
- **Pink ("say small")**: Single node at L11 (top-right), annotated "small" (16.32%).
2. **Edge Patterns**:
- Edges connect nodes across levels, forming dense clusters within categories and sparse connections between categories.
- The pink node at L11 has the highest density of incoming edges (16.32% annotation suggests significance).
3. **Textual Labels**:
- X-axis labels include programming-like terms ("nooffset()", "The") and adjectives ("opposite," "large," "small").
- The pink node’s label "small" is repeated on the x-axis, possibly indicating a recursive or hierarchical relationship.
### Key Observations
- **Hierarchical Clustering**: Nodes are grouped by attribute (color) and level (y-axis), suggesting a structured hierarchy.
- **Dominant Node**: The pink "small" node at L11 has the highest percentage (16.32%), indicating it may be a critical or terminal node.
- **Categorical Separation**: Clear spatial separation of clusters (green at bottom, orange in middle, blue on right, pink at top).
### Interpretation
The diagram likely represents a network where nodes are categorized by attributes (e.g., "opposite," "large") and organized into hierarchical levels. The pink "small" node at L11, with its high percentage, may represent a pivotal or aggregated outcome of the network’s structure. The x-axis labels ("nooffset()", "The") suggest computational or linguistic processing, possibly modeling relationships between terms or variables. The dense connections within categories imply strong intra-cluster relationships, while sparse inter-cluster edges highlight modularity. The "say small" label at the top could denote a final state or summary metric derived from lower-level interactions.