## Line Chart: Complexity and Surplus Over Timesteps
### Overview
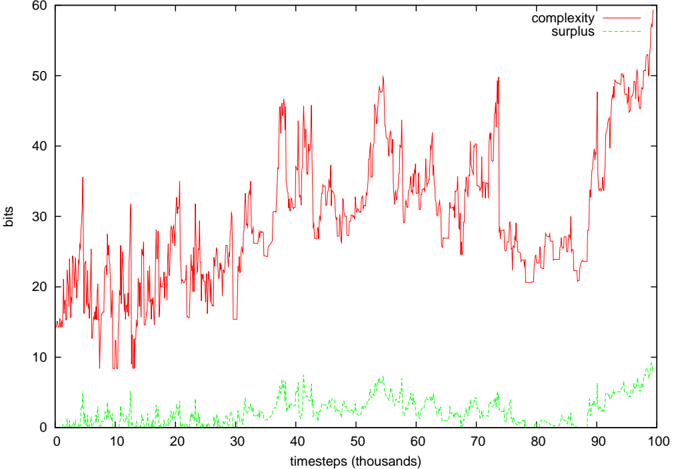
The image is a 2D line chart displaying two data series over a period of 100,000 timesteps. The chart plots the values of "complexity" and "surplus," measured in bits, against time. The overall visual impression is of a highly volatile red series ("complexity") with a general upward trend, contrasted with a much lower, less volatile green series ("surplus").
### Components/Axes
* **Chart Type:** Line chart with two data series.
* **X-Axis:**
* **Label:** `timesteps (thousands)`
* **Scale:** Linear, ranging from 0 to 100.
* **Major Tick Marks:** At intervals of 10 (0, 10, 20, ..., 100).
* **Y-Axis:**
* **Label:** `bits`
* **Scale:** Linear, ranging from 0 to 60.
* **Major Tick Marks:** At intervals of 10 (0, 10, 20, ..., 60).
* **Legend:**
* **Position:** Top-right corner of the chart area.
* **Series 1:** `complexity` - Represented by a solid red line.
* **Series 2:** `surplus` - Represented by a dashed green line.
### Detailed Analysis
**1. "complexity" (Red, Solid Line):**
* **Trend Verification:** The line exhibits high-frequency volatility throughout the entire range. Despite the noise, a clear, non-linear upward trend is visible. The value starts near 15 bits at timestep 0 and ends near 55 bits at timestep 100,000. The growth is not steady; it features periods of sharp increase, plateau, and even decline.
* **Key Data Points (Approximate):**
* Start (t=0): ~15 bits.
* First major peak: ~35 bits around t=5,000.
* Significant dip: Below 10 bits around t=12,000.
* High plateau region: Between t=35,000 and t=45,000, values fluctuate between ~25 and ~48 bits.
* Another major peak: ~50 bits around t=55,000.
* Notable decline: Drops to ~20 bits around t=80,000.
* Final surge: Rises sharply from ~25 bits at t=90,000 to its maximum of ~55 bits at t=100,000.
**2. "surplus" (Green, Dashed Line):**
* **Trend Verification:** This series remains at a much lower magnitude than complexity. It shows moderate volatility but with a much smaller amplitude. A slight upward trend becomes discernible in the final quarter of the timeline.
* **Key Data Points (Approximate):**
* Baseline: Fluctuates primarily between 0 and 5 bits for the first 80,000 timesteps.
* Minor peaks: Reaches ~7 bits around t=40,000 and t=55,000.
* Final trend: Begins a more sustained, gentle rise from approximately t=85,000, ending at its highest point of ~9 bits at t=100,000.
### Key Observations
1. **Magnitude Disparity:** The "complexity" values are consistently an order of magnitude larger than the "surplus" values. The gap between them widens over time.
2. **Correlation of Peaks:** Some peaks in the "surplus" series (e.g., around t=40k and t=55k) appear to coincide with local peaks or high-volatility periods in the "complexity" series, suggesting a potential weak positive correlation during those intervals.
3. **Volatility Contrast:** The "complexity" series is characterized by extreme, jagged volatility, while the "surplus" series, though noisy, has a smoother profile.
4. **Late-Stage Behavior:** Both series show their most pronounced upward movement in the final 10,000 timesteps (90k to 100k), with "complexity" surging dramatically and "surplus" reaching its peak.
### Interpretation
This chart likely visualizes metrics from a computational, biological, or information-theoretic model evolving over time. The "complexity" metric (in bits) appears to represent the amount of information or structural intricacy within the system. Its volatile yet upward trajectory suggests the system is undergoing a process of growth or learning, but in a non-smooth, potentially punctuated equilibrium fashion—where periods of rapid change alternate with consolidation.
The "surplus" metric, also in bits, could represent excess capacity, redundant information, or a resource buffer. Its consistently low value relative to complexity implies the system operates with minimal slack. The slight rise in surplus at the end, concurrent with the complexity surge, might indicate that the system is finally accumulating a small reserve as it reaches a higher state of organization, or that the process driving the final complexity increase also generates a small amount of incidental surplus.
The most significant takeaway is the **divergent scaling** of the two metrics. The system's complexity grows substantially, while its surplus does not keep pace. This could point to an efficient process where resources are tightly coupled to functional complexity, or conversely, to a system becoming increasingly "tight" and potentially fragile, with little excess capacity to handle perturbations. The late-stage rise in both could mark a phase transition or the culmination of a long-term evolutionary or learning process.