## Line Chart: Complexity vs. Surplus Over Timesteps
### Overview
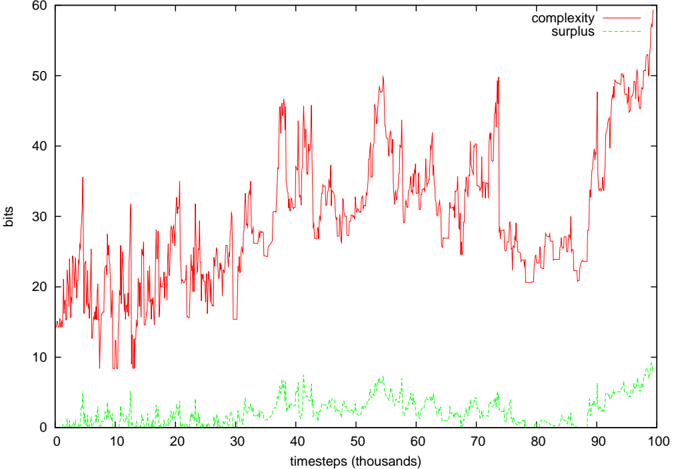
The image is a line chart depicting two data series: "complexity" (solid red line) and "surplus" (dashed green line) across 100,000 timesteps. The y-axis represents "bits," while the x-axis represents "timesteps (thousands)." The red line exhibits significant fluctuations, while the green line remains relatively stable but low.
### Components/Axes
- **X-axis**: "timesteps (thousands)" with markers at 0, 10, 20, ..., 100 (in thousands).
- **Y-axis**: "bits" with markers at 0, 10, 20, ..., 60.
- **Legend**: Located in the top-right corner. Red = "complexity," Green (dashed) = "surplus."
- **Lines**:
- Red (complexity): Dominates the upper portion of the chart.
- Green (surplus): Confined to the lower 10% of the y-axis.
### Detailed Analysis
- **Complexity (Red Line)**:
- Starts at ~15 bits (timestep 0).
- Peaks at ~50 bits (timestep ~30k) and ~55 bits (timestep ~95k).
- Exhibits sharp upward/downward spikes, with an overall upward trend.
- Average value: ~30–40 bits, with outliers reaching ~55 bits.
- **Surplus (Green Line)**:
- Remains below 10 bits throughout.
- Peaks at ~8 bits (timestep ~50k) and ~9 bits (timestep ~95k).
- Average value: ~3–5 bits, with minor fluctuations.
### Key Observations
1. **Complexity Dominance**: The red line consistently exceeds the green line by 20–50 bits, indicating complexity is orders of magnitude higher than surplus.
2. **Volatility**: Complexity shows erratic behavior, with sharp increases and drops (e.g., ~20k to 30k timesteps).
3. **Stability**: Surplus remains stable, with no significant upward/downward trends.
4. **No Intersection**: The two lines never converge, suggesting no overlap in their magnitudes.
### Interpretation
- **Trend Implications**: The upward trend in complexity suggests increasing system/resource demands over time, while the stable surplus implies limited capacity to accommodate growth. This could indicate a system approaching resource constraints.
- **Anomalies**: The sharp peaks in complexity (e.g., ~30k and ~95k timesteps) may correspond to critical events (e.g., system upgrades, failures). The surplus’s minor fluctuations might reflect minor adjustments in resource allocation.
- **Relationship**: The lack of correlation between the two lines suggests they are influenced by independent factors. For example, complexity could relate to algorithmic changes, while surplus might reflect fixed resource pools.
### Spatial Grounding
- **Legend**: Top-right corner, clearly associating colors with labels.
- **Lines**: Red (complexity) occupies the upper 80% of the y-axis; green (surplus) is confined to the lower 10%.
### Content Details
- **Complexity Values**:
- Timestep 0: ~15 bits.
- Timestep 30k: ~50 bits (peak).
- Timestep 95k: ~55 bits (final peak).
- **Surplus Values**:
- Timestep 0: ~2 bits.
- Timestep 50k: ~8 bits (peak).
- Timestep 95k: ~9 bits (final peak).
### Key Observations (Reiterated)
- Complexity’s volatility contrasts with surplus’s stability.
- No overlap between the two lines, emphasizing their distinct magnitudes.
### Interpretation (Reiterated)
The data highlights a critical imbalance: rising complexity outpaces surplus capacity, raising concerns about sustainability. The system may require intervention to address resource allocation or complexity management.