\n
## Diagram: Integrating Interpretability
### Overview
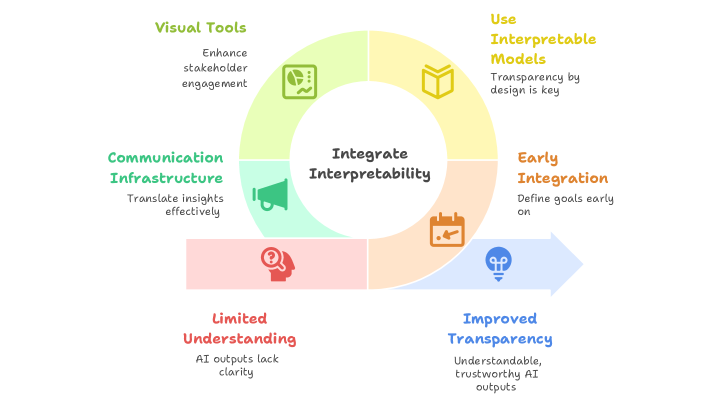
The image is a circular diagram illustrating a process for integrating interpretability, moving from limited understanding to improved transparency. It depicts a cyclical flow with four key areas connected to a central "Integrate Interpretability" hub. There are two directional arrows indicating a progression from the bottom to the top-right.
### Components/Axes
The diagram consists of the following components:
* **Central Hub:** "Integrate Interpretability" (in black text on a white circle)
* **Four Quadrants/Areas:**
* Visual Tools (Yellow) - "Enhance stakeholder engagement"
* Use Interpretable Models (Yellow) - "Transparency by design is key"
* Communication Infrastructure (Green) - "Translate insights effectively"
* Limited Understanding (Red) - "AI outputs lack clarity"
* Early Integration (Blue) - "Define goals early on"
* Improved Transparency (Blue) - "Understandable, trustworthy AI outputs"
* **Arrows:** Two arrows indicating flow:
* From "Limited Understanding" to "Improved Transparency" (Red to Blue)
* From "Improved Transparency" to "Early Integration" (Blue to Yellow)
* From "Early Integration" to "Use Interpretable Models" (Yellow to Yellow)
* From "Use Interpretable Models" to "Visual Tools" (Yellow to Green)
* From "Visual Tools" to "Communication Infrastructure" (Green to Green)
* From "Communication Infrastructure" to "Limited Understanding" (Green to Red)
* **Icons:** Small icons are present within each quadrant, visually representing the concept.
### Detailed Analysis or Content Details
The diagram doesn't contain numerical data. It's a conceptual model. The flow is as follows:
1. Starting with "Limited Understanding" (AI outputs lack clarity).
2. Moving towards "Improved Transparency" (Understandable, trustworthy AI outputs).
3. Progressing to "Early Integration" (Define goals early on).
4. Then to "Use Interpretable Models" (Transparency by design is key).
5. To "Visual Tools" (Enhance stakeholder engagement).
6. To "Communication Infrastructure" (Translate insights effectively).
7. Finally, looping back to "Limited Understanding".
The diagram suggests a continuous cycle of improvement.
### Key Observations
The diagram emphasizes the importance of interpretability in AI development and deployment. It highlights that achieving transparency requires a holistic approach, encompassing model design, communication, and stakeholder engagement. The cyclical nature suggests that interpretability is not a one-time fix but an ongoing process. The red-to-blue arrow visually represents a positive transformation.
### Interpretation
This diagram illustrates a framework for building and deploying AI systems that are not only accurate but also understandable and trustworthy. The core idea is that interpretability should be integrated throughout the entire AI lifecycle, from initial goal setting to model design and communication of results. The diagram suggests that by focusing on interpretability, organizations can move from a state of "limited understanding" of their AI systems to one of "improved transparency," leading to greater confidence and adoption. The cycle emphasizes that this is not a linear process, but requires continuous effort and refinement. The use of color coding (red for negative, blue/yellow/green for positive) reinforces the desired outcome of increased transparency and trust. The diagram is a high-level conceptual model and doesn't provide specific implementation details. It's a communication tool intended to convey the importance of interpretability to a broad audience.