## Line Chart: Pass Rate vs. Steps
### Overview
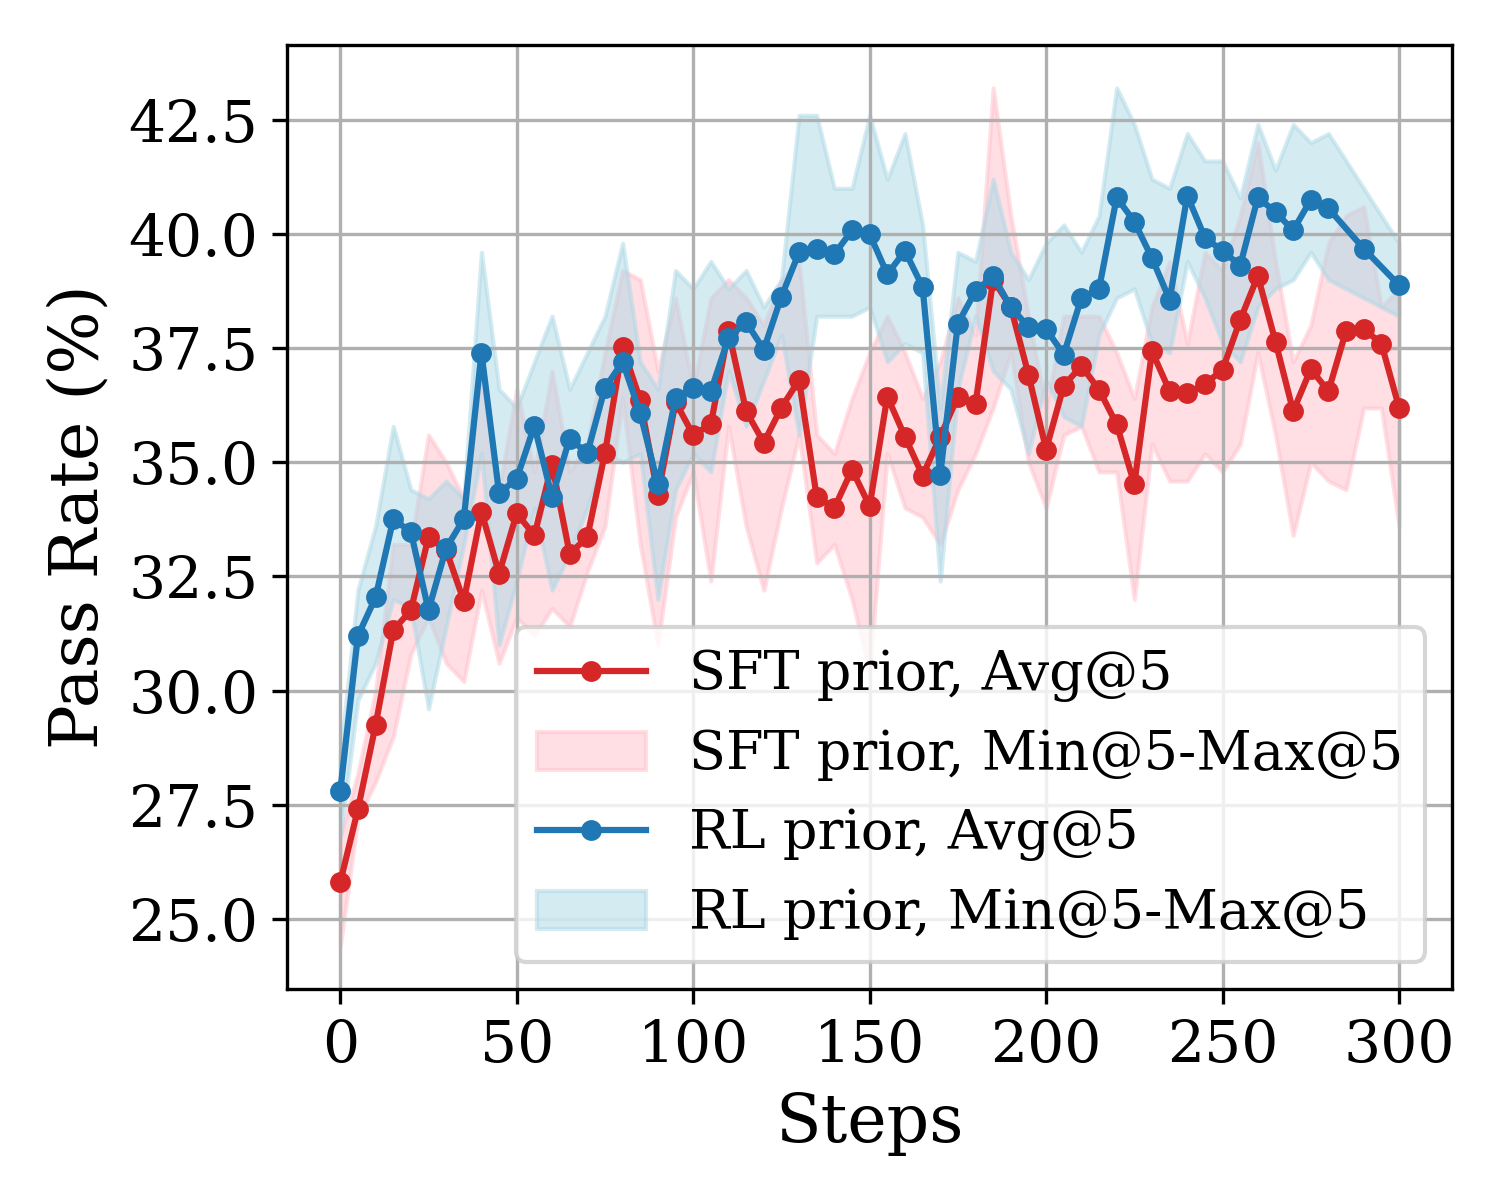
The image is a line chart comparing the pass rate (%) of two different methods, SFT prior and RL prior, over a range of steps (0 to 300). Each method has two lines representing the average pass rate (Avg@5) and the range between the minimum and maximum pass rates (Min@5-Max@5).
### Components/Axes
* **X-axis:** Steps, ranging from 0 to 300 in increments of 50.
* **Y-axis:** Pass Rate (%), ranging from 25.0 to 42.5 in increments of 2.5.
* **Legend (bottom-right):**
* Red line with dots: SFT prior, Avg@5
* Light red shaded area: SFT prior, Min@5-Max@5
* Blue line with dots: RL prior, Avg@5
* Light blue shaded area: RL prior, Min@5-Max@5
### Detailed Analysis
* **SFT prior, Avg@5 (Red Line):**
* Trend: Generally increases from approximately 26% at step 0 to around 37% at step 300, with fluctuations.
* Data Points:
* Step 0: ~26%
* Step 50: ~34%
* Step 100: ~36%
* Step 150: ~35%
* Step 200: ~37%
* Step 250: ~37%
* Step 300: ~37%
* **SFT prior, Min@5-Max@5 (Light Red Shaded Area):**
* Represents the range of pass rates for the SFT prior method. The shaded area widens and narrows, indicating the variability in pass rates at different steps.
* **RL prior, Avg@5 (Blue Line):**
* Trend: Generally increases from approximately 31% at step 0 to around 40% at step 300, with fluctuations.
* Data Points:
* Step 0: ~31%
* Step 50: ~37%
* Step 100: ~37%
* Step 150: ~39%
* Step 200: ~40%
* Step 250: ~40%
* Step 300: ~39%
* **RL prior, Min@5-Max@5 (Light Blue Shaded Area):**
* Represents the range of pass rates for the RL prior method. The shaded area widens and narrows, indicating the variability in pass rates at different steps.
### Key Observations
* The RL prior method generally outperforms the SFT prior method in terms of average pass rate.
* Both methods show an initial increase in pass rate, followed by fluctuations.
* The variability in pass rates (as indicated by the shaded areas) appears to be higher in the initial steps for both methods.
### Interpretation
The chart suggests that the RL prior method is more effective than the SFT prior method in achieving higher pass rates. The fluctuations in pass rates indicate that the performance of both methods is not consistent across all steps. The wider shaded areas in the initial steps suggest that the methods are less stable during the initial stages of training or evaluation. The "Avg@5" and "Min@5-Max@5" likely refer to averaging the pass rate over a window of 5 steps and the range of pass rates within that window, respectively. This smoothing helps to visualize the overall trend and variability in the data.