\n
## Line Chart: Pass Rate vs. Steps for Different Priors
### Overview
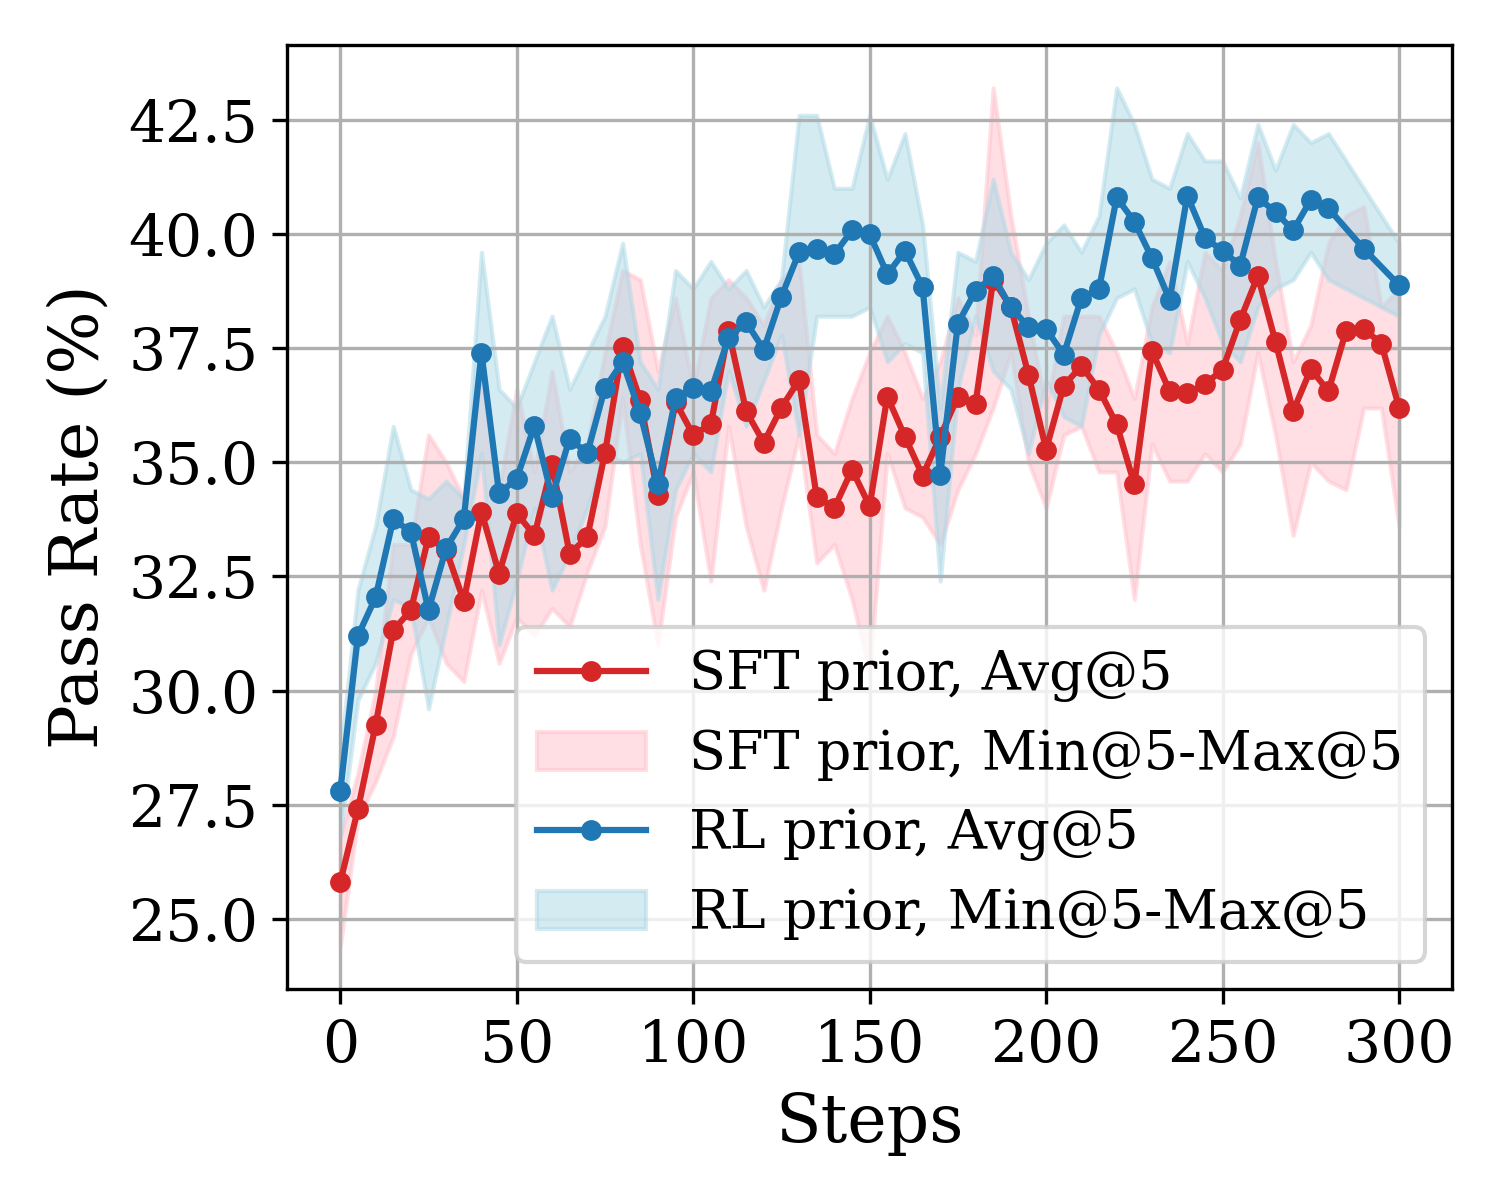
This line chart depicts the pass rate as a function of steps, comparing two different priors: SFT (Supervised Fine-Tuning) and RL (Reinforcement Learning). Each prior is represented by two lines: one for the average at 5 (Avg@5) and another representing the minimum to maximum range over 5 (Min@5-Max@5). The chart aims to illustrate how the pass rate evolves over training steps for each approach.
### Components/Axes
* **X-axis:** "Steps" - ranging from 0 to 300, with tick marks every 50 steps.
* **Y-axis:** "Pass Rate (%)" - ranging from 25% to 42.5%, with tick marks every 2.5%.
* **Legend:** Located in the center-right of the chart.
* "SFT prior, Avg@5" - represented by a red line with circular markers.
* "SFT prior, Min@5-Max@5" - represented by a light red shaded area.
* "RL prior, Avg@5" - represented by a blue line with circular markers.
* "RL prior, Min@5-Max@5" - represented by a light blue shaded area.
* **Gridlines:** Present throughout the chart for easier readability.
### Detailed Analysis
**SFT Prior:**
* **Avg@5 (Red Line):** The line starts at approximately 32.5% at step 0 and exhibits a generally upward trend, with fluctuations. It reaches a peak of around 39% at step 200, then dips and rises again, ending at approximately 38% at step 300.
* Step 0: ~32.5%
* Step 50: ~35.5%
* Step 100: ~36.5%
* Step 150: ~37.5%
* Step 200: ~39.0%
* Step 250: ~37.0%
* Step 300: ~38.0%
* **Min@5-Max@5 (Light Red Area):** The shaded area fluctuates around the Avg@5 line, indicating the range of pass rates. It starts wider at the beginning (around 30% to 36% at step 0) and narrows somewhat as steps increase, but remains relatively broad throughout, suggesting variability in the pass rates. At step 300, the range is approximately 36% to 40%.
**RL Prior:**
* **Avg@5 (Blue Line):** The line starts at approximately 33% at step 0 and also shows an upward trend with fluctuations. It reaches a peak of around 40% at step 275, and ends at approximately 39.5% at step 300.
* Step 0: ~33.0%
* Step 50: ~36.0%
* Step 100: ~37.0%
* Step 150: ~37.5%
* Step 200: ~38.0%
* Step 250: ~39.5%
* Step 300: ~39.5%
* **Min@5-Max@5 (Light Blue Area):** Similar to the SFT prior, the shaded area represents the range of pass rates. It starts wider (around 31% to 37% at step 0) and fluctuates around the Avg@5 line. At step 300, the range is approximately 37% to 41%.
### Key Observations
* Both SFT and RL priors show an increasing trend in pass rate with increasing steps, indicating learning over time.
* The RL prior generally achieves a slightly higher pass rate than the SFT prior, particularly in the later stages of training (after step 200).
* The range (Min@5-Max@5) indicates variability in the pass rates for both priors, suggesting that performance can fluctuate even at the same step.
* The fluctuations in both lines suggest that the training process is not perfectly smooth and may be sensitive to the specific training data or random seeds.
### Interpretation
The chart demonstrates the learning progress of two different approaches (SFT and RL) in a task where a "pass rate" is measurable. The upward trends for both priors suggest that both methods are capable of improving performance over time. The consistently higher pass rate achieved by the RL prior suggests that it may be a more effective approach for this particular task, or that it requires fewer steps to reach a comparable level of performance. The variability indicated by the shaded areas highlights the stochastic nature of the training process and the importance of considering multiple runs or averaging results to obtain a more reliable estimate of performance. The fluctuations could be due to the inherent randomness in the training process, or to the presence of challenging examples that require more steps to learn. The chart provides valuable insights into the relative effectiveness of the two priors and the dynamics of the learning process.