\n
## Line Chart: Performance Progression of SFT vs. RL Priors
### Overview
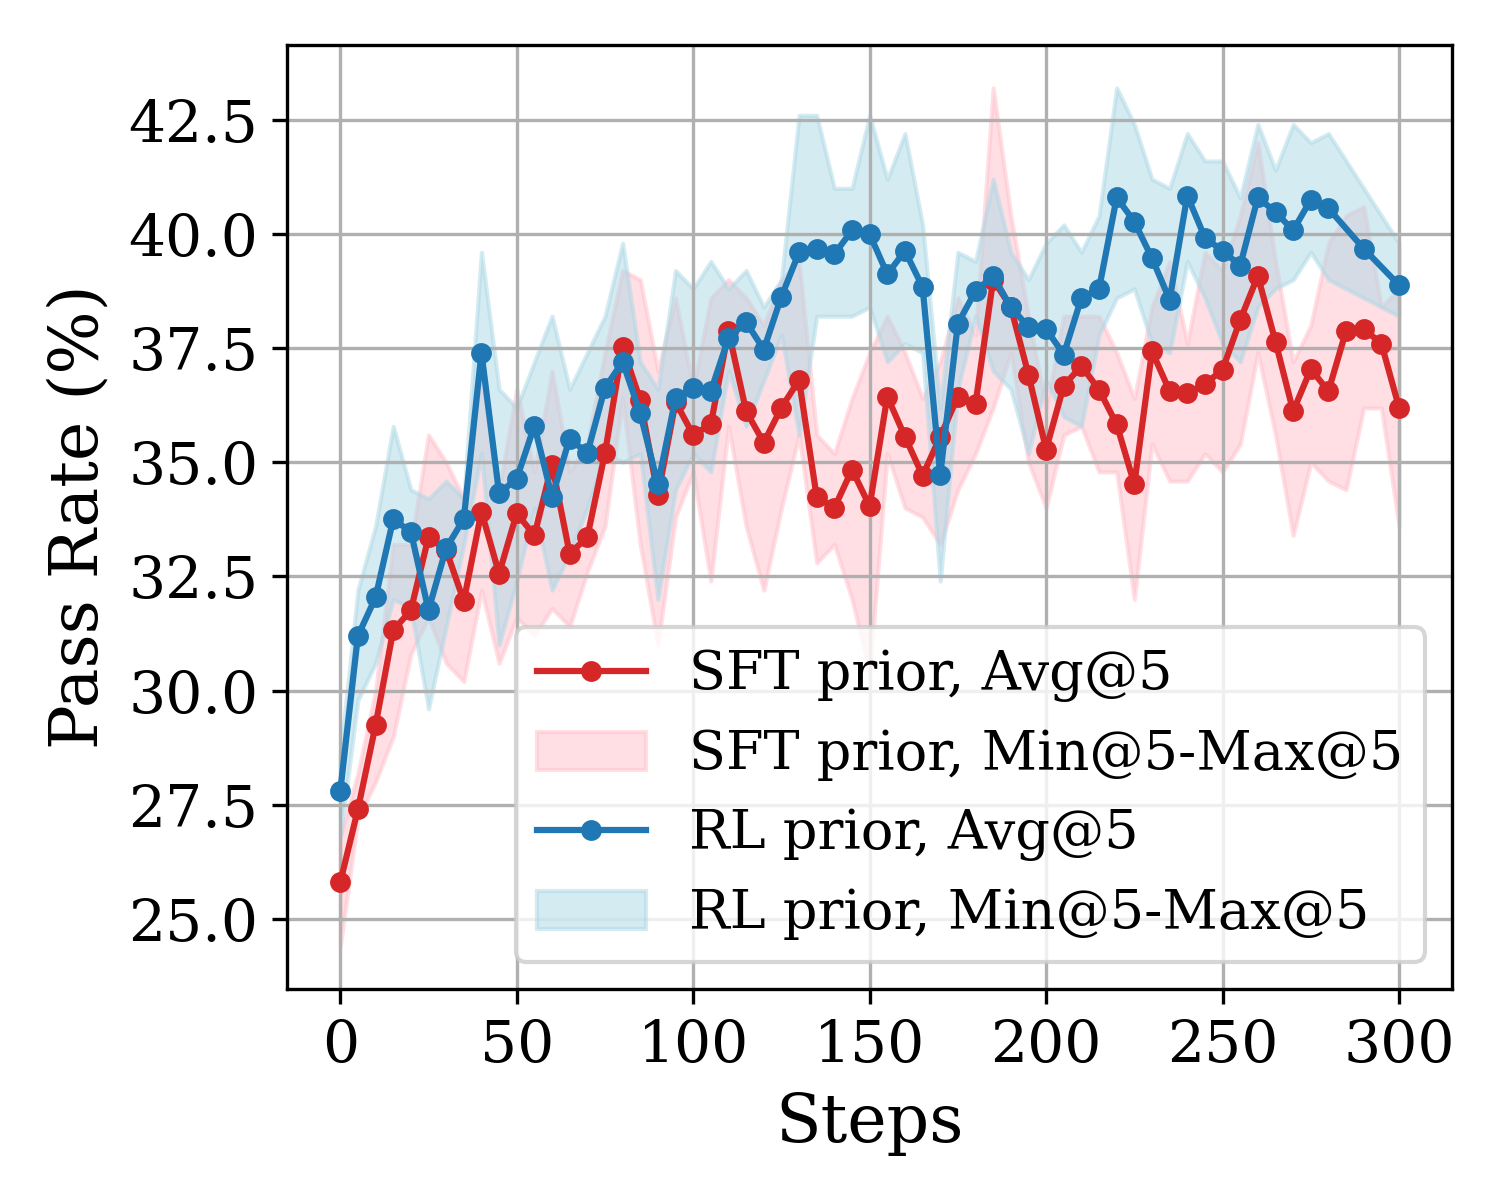
The image is a line chart comparing the performance of two different model training approaches—SFT (Supervised Fine-Tuning) prior and RL (Reinforcement Learning) prior—over the course of 300 training steps. Performance is measured by a "Pass Rate (%)" metric. Each approach is represented by an average line (Avg@5) and a shaded region indicating the range between the minimum and maximum values over 5 runs (Min@5-Max@5).
### Components/Axes
* **Chart Type:** Line chart with shaded confidence/range bands.
* **X-Axis:**
* **Label:** "Steps"
* **Scale:** Linear, from 0 to 300.
* **Major Tick Marks:** 0, 50, 100, 150, 200, 250, 300.
* **Y-Axis:**
* **Label:** "Pass Rate (%)"
* **Scale:** Linear, from 25.0 to 42.5.
* **Major Tick Marks:** 25.0, 27.5, 30.0, 32.5, 35.0, 37.5, 40.0, 42.5.
* **Legend (Positioned in the bottom-right quadrant of the plot area):**
1. **Red line with circular markers:** "SFT prior, Avg@5"
2. **Light pink shaded area:** "SFT prior, Min@5-Max@5"
3. **Blue line with circular markers:** "RL prior, Avg@5"
4. **Light blue shaded area:** "RL prior, Min@5-Max@5"
### Detailed Analysis
**1. SFT prior, Avg@5 (Red Line):**
* **Trend:** Starts at the lowest point (~25.8% at step 0). Shows a rapid initial increase, followed by a generally upward but highly volatile trend with frequent peaks and troughs. The growth rate slows after approximately step 150.
* **Key Data Points (Approximate):**
* Step 0: ~25.8%
* Step 50: ~33.5%
* Step 100: ~36.0%
* Step 150: ~34.5% (a local trough)
* Step 200: ~37.0%
* Step 250: ~37.0%
* Step 300: ~36.2%
* **Range (Pink Shaded Area):** The min-max range is substantial throughout, often spanning 3-5 percentage points. The range appears widest around steps 150-200 and 250-300, indicating high variance in performance across different runs at those stages.
**2. RL prior, Avg@5 (Blue Line):**
* **Trend:** Starts higher than SFT (~27.8% at step 0). Also shows a rapid initial increase. Its upward trend appears slightly more consistent and less volatile than the SFT line, especially after step 100. It maintains a performance lead over the SFT average for nearly the entire duration.
* **Key Data Points (Approximate):**
* Step 0: ~27.8%
* Step 50: ~37.5% (a sharp peak)
* Step 100: ~36.5%
* Step 150: ~40.0%
* Step 200: ~39.0%
* Step 250: ~41.0%
* Step 300: ~38.8%
* **Range (Blue Shaded Area):** The min-max range is also significant but appears slightly narrower on average than the SFT range, particularly in the later stages (steps 200-300). This suggests the RL prior may yield more consistent results across runs.
### Key Observations
1. **Performance Gap:** The RL prior (blue) consistently outperforms the SFT prior (red) on average after the initial steps. The gap is most pronounced around steps 150 and 250.
2. **Volatility:** Both methods exhibit high volatility, as seen in the jagged average lines and wide shaded ranges. However, the SFT prior's average line appears more erratic.
3. **Convergence and Divergence:** The two average lines converge briefly around step 100 and step 175 but otherwise maintain a separation. The shaded ranges overlap significantly throughout, indicating that while the averages differ, individual runs from either method can achieve similar performance levels.
4. **Peak Performance:** The highest observed average pass rate is achieved by the RL prior, reaching approximately 41% around step 250. The SFT prior's average peaks lower, at around 38-39%.
### Interpretation
This chart demonstrates a comparative analysis of two training methodologies for a task measured by a pass rate. The data suggests that, on average, the **RL prior approach leads to better final performance and a more stable learning trajectory** than the SFT prior approach over 300 steps.
* **Effectiveness:** The RL prior's higher starting point and sustained lead imply it may provide a better initialization or learning signal for this specific task.
* **Stability:** The slightly narrower range for the RL prior suggests it is less sensitive to random seeds or initial conditions, making it a more reliable method.
* **Underlying Dynamics:** The high volatility in both curves indicates the training process is noisy or the evaluation metric is sensitive. The fact that the ranges overlap heavily means that while RL is better *on average*, a well-tuned SFT run could still match a poorly-tuned RL run.
* **Practical Implication:** If the goal is to maximize the expected pass rate with reliable results, the RL prior appears to be the superior choice based on this data. However, the significant variance warns that multiple runs are necessary to gauge true performance for either method.