# Technical Document Extraction: Line Graph Analysis
## Image Type
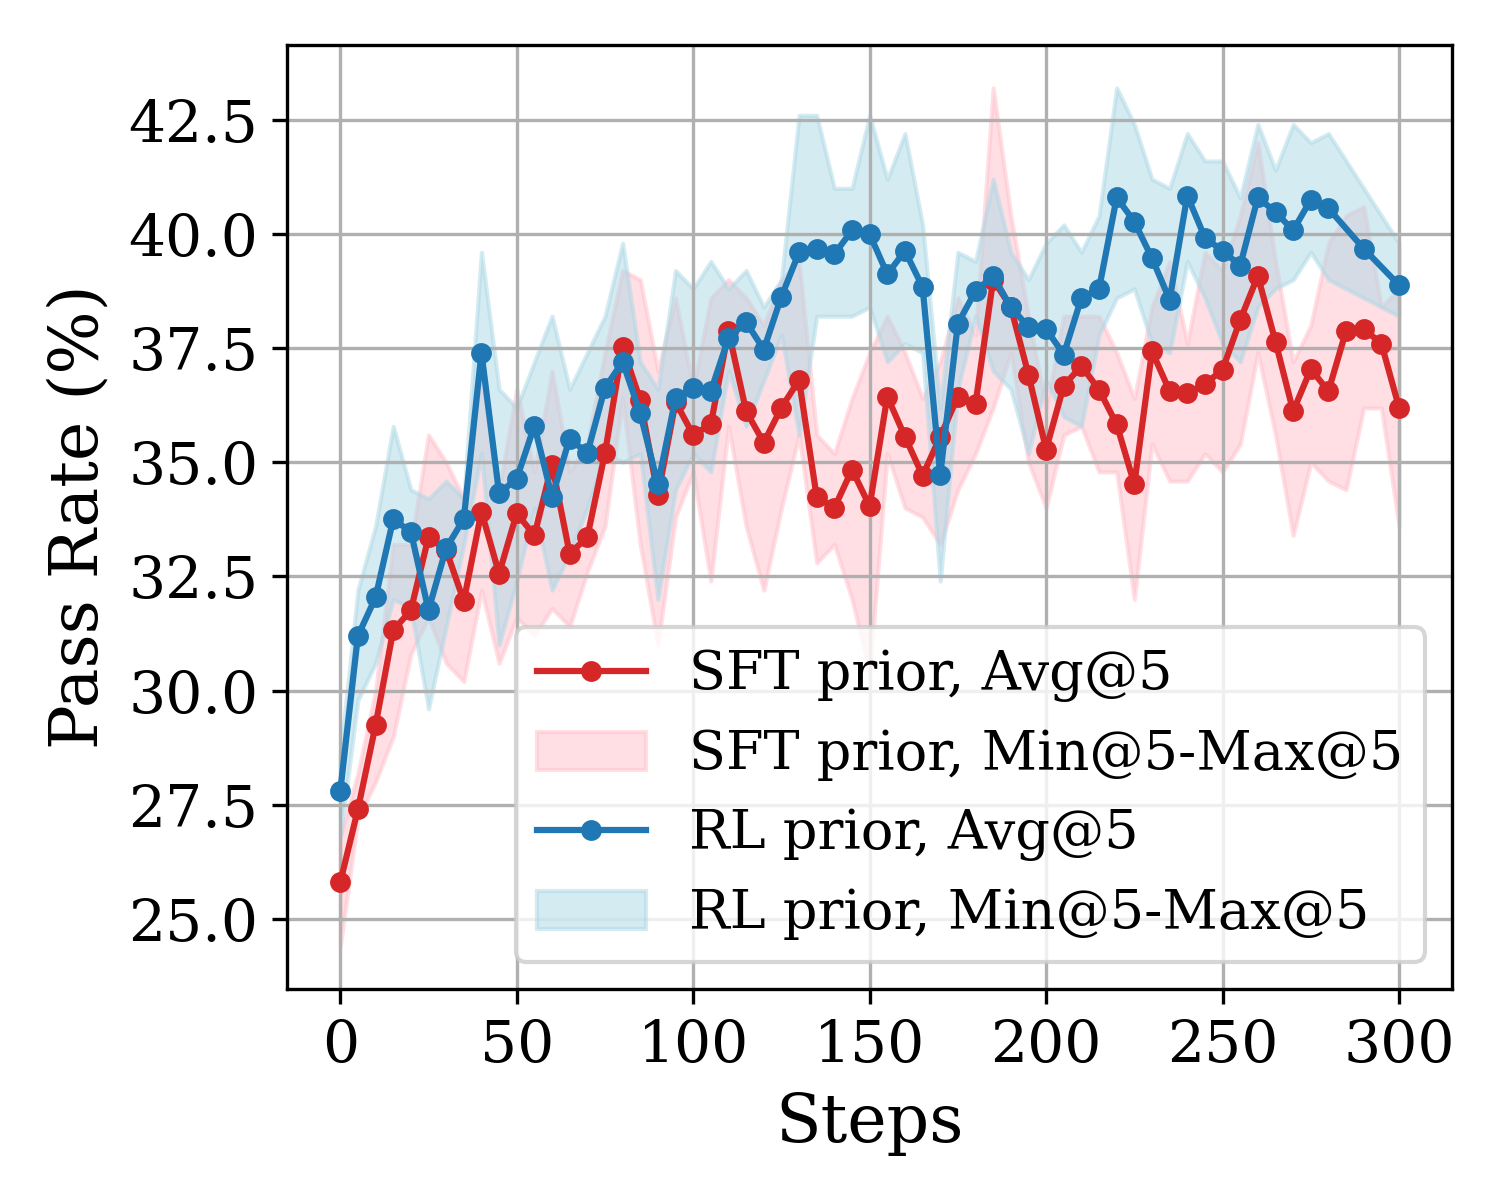
The image is a **line graph** with shaded regions representing variability in pass rate data over steps.
---
## Axes and Labels
- **X-axis (Horizontal):**
- Title: `Steps`
- Scale: Linear, ranging from `0` to `300` with markers at intervals of `50` (0, 50, 100, 150, 200, 250, 300).
- **Y-axis (Vertical):**
- Title: `Pass Rate (%)`
- Scale: Linear, ranging from `25.0` to `42.5` with markers at intervals of `2.5` (25.0, 27.5, 30.0, 32.5, 35.0, 37.5, 40.0, 42.5).
---
## Legend
- **Placement:** Bottom-right corner of the graph.
- **Entries:**
1. **Red line with circles:** `SFT prior, Avg@5`
2. **Red shaded area:** `SFT prior, Min@5-Max@5`
3. **Blue line with circles:** `RL prior, Avg@5`
4. **Blue shaded area:** `RL prior, Min@5-Max@5`
---
## Data Series and Trends
### 1. **SFT Prior (Red)**
- **Avg@5 (Red Line):**
- Starts at ~26% at `Steps = 0`.
- Gradually increases to ~37.5% at `Steps = 300`.
- Exhibits minor fluctuations (e.g., dips at ~50, 150, and 250 steps).
- **Min@5-Max@5 (Red Shaded Area):**
- Represents variability around the average.
- Width of the shaded region indicates variability (e.g., narrower at `Steps = 0`, wider at `Steps = 200`).
### 2. **RL Prior (Blue)**
- **Avg@5 (Blue Line):**
- Starts at ~27.5% at `Steps = 0`.
- Increases more steeply than SFT prior, reaching ~40% at `Steps = 300`.
- Shows pronounced fluctuations (e.g., sharp peaks at ~100, 150, and 250 steps).
- **Min@5-Max@5 (Blue Shaded Area):**
- Wider variability compared to SFT prior, especially at higher steps.
---
## Spatial Grounding
- **Legend Colors:**
- Red corresponds to `SFT prior` (line and shaded area).
- Blue corresponds to `RL prior` (line and shaded area).
- **Data Point Alignment:**
- Red circles align with the red line and shaded area.
- Blue circles align with the blue line and shaded area.
---
## Key Observations
1. **Performance Comparison:**
- RL prior consistently outperforms SFT prior in pass rate, especially at later steps (e.g., ~30% vs. ~37.5% at `Steps = 300`).
2. **Variability:**
- RL prior exhibits higher variability (wider shaded regions) compared to SFT prior.
3. **Trend Direction:**
- Both methods show an upward trend, but RL prior accelerates more sharply.
---
## Notes
- No additional text, tables, or non-English content is present in the image.
- The graph focuses on comparing two prior methods (`SFT` and `RL`) across steps, with pass rate as the metric.