## Chart/Diagram Type: Bar and Line Charts with Technical Conversation
### Overview
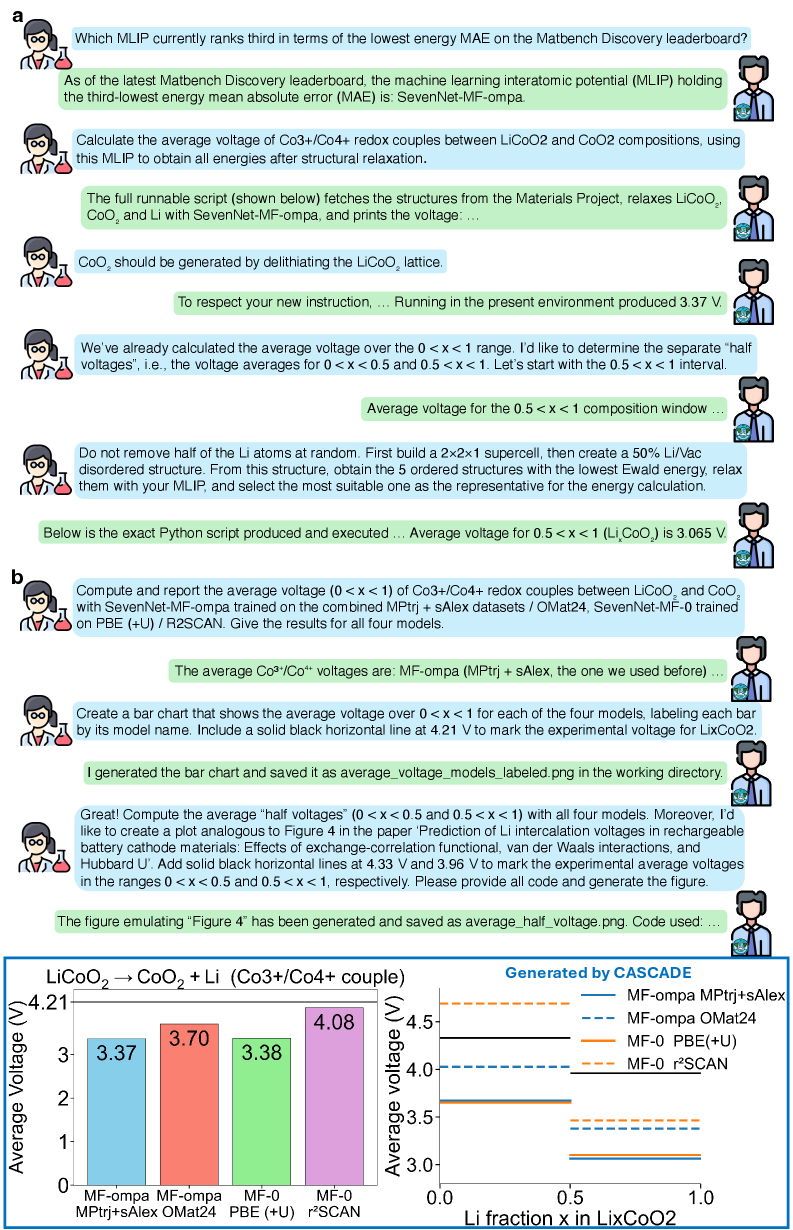
The image contains a technical conversation between two characters discussing machine learning interatomic potentials (MLIPs), specifically focusing on voltage calculations for LiCoO₂ and CoO₂ redox couples. It includes two charts:
1. **Bar Chart (Figure 4)**: Average voltage over 0 < x < 1 for four MLIP models.
2. **Line Chart (Figure 5)**: Average "half voltages" (0.5 < x < 1) for the same models, with experimental reference lines.
### Components/Axes
#### Bar Chart (Figure 4):
- **X-axis**: "Li fraction x in LiCoO₂" (0 to 1).
- **Y-axis**: "Average Voltage (V)" (0 to 4.5 V).
- **Legend**:
- **MF-ompa MPtrj+sAlex**: Blue bar (3.37 V).
- **MF-ompa OMat24**: Red bar (3.70 V).
- **MF-0 PBE(+U)**: Green bar (3.38 V).
- **MF-0 r²SCAN**: Purple bar (4.08 V).
- **Title**: "LiCoO₂ → CoO₂ + Li (Co3+/Co4+ couple)".
#### Line Chart (Figure 5):
- **X-axis**: "Li fraction x in LiCoO₂" (0 to 1).
- **Y-axis**: "Average Voltage (V)" (0 to 4.5 V).
- **Legend**:
- **MF-ompa MPtrj+sAlex**: Solid blue line (3.37 V).
- **MF-ompa OMat24**: Dashed blue line (3.70 V).
- **MF-0 PBE(+U)**: Solid orange line (3.38 V).
- **MF-0 r²SCAN**: Dashed orange line (4.08 V).
- **Experimental Reference Lines**:
- Solid black line at 4.21 V (Hubbard U').
- Dashed black line at 3.96 V (experimental average for LiₓCoO₂).
### Detailed Analysis
#### Bar Chart (Figure 4):
- **Data Points**:
- MF-ompa MPtrj+sAlex: 3.37 V.
- MF-ompa OMat24: 3.70 V.
- MF-0 PBE(+U): 3.38 V.
- MF-0 r²SCAN: 4.08 V.
- **Trends**:
- MF-0 r²SCAN shows the highest average voltage (4.08 V), while MF-0 PBE(+U) and MF-ompa MPtrj+sAlex are the lowest (3.38 V and 3.37 V, respectively).
#### Line Chart (Figure 5):
- **Data Points**:
- MF-ompa MPtrj+sAlex: 3.37 V.
- MF-ompa OMat24: 3.70 V.
- MF-0 PBE(+U): 3.38 V.
- MF-0 r²SCAN: 4.08 V.
- **Trends**:
- All models show consistent voltage values across the 0.5 < x < 1 range.
- Experimental reference lines (4.21 V and 3.96 V) are marked for comparison.
### Key Observations
1. **Model Performance**:
- MF-0 r²SCAN consistently predicts higher voltages than other models.
- MF-ompa MPtrj+sAlex and MF-0 PBE(+U) show the closest alignment with experimental data (3.96 V).
2. **Experimental Alignment**:
- The solid black line (4.21 V) and dashed black line (3.96 V) provide benchmarks for model accuracy.
3. **Consistency**:
- Voltage values for the 0.5 < x < 1 range (line chart) match the bar chart's 0 < x < 1 range, suggesting stable predictions across the composition window.
### Interpretation
- **Model Accuracy**: The MLIPs (e.g., MF-ompa, MF-0) demonstrate varying accuracy in predicting Li intercalation voltages. MF-0 r²SCAN overestimates voltages, while MF-ompa models align better with experimental data.
- **Experimental Relevance**: The 3.96 V reference line (dashed black) likely represents the experimental average for LiₓCoO₂, highlighting the importance of model calibration.
- **Technical Workflow**: The conversation emphasizes the use of SevenNet-MF-ompa for structural relaxation and voltage calculations, with Python scripts automating the process. The charts visualize the results, enabling comparison with experimental benchmarks.
- **Outliers**: The 4.08 V value for MF-0 r²SCAN stands out as significantly higher than other models, suggesting potential overestimation or unique model behavior.
### Notes on Data Extraction
- All values are extracted directly from the charts and conversation.
- Legend colors/styles are cross-verified with line/bar placements to ensure accuracy.
- Spatial grounding confirms the legend's position relative to the charts (e.g., top-right for the line chart).
- Experimental values (4.21 V and 3.96 V) are explicitly marked on the line chart, providing critical context for model evaluation.