\n
## Diagram: Illustration of Different Types and Methods
### Overview
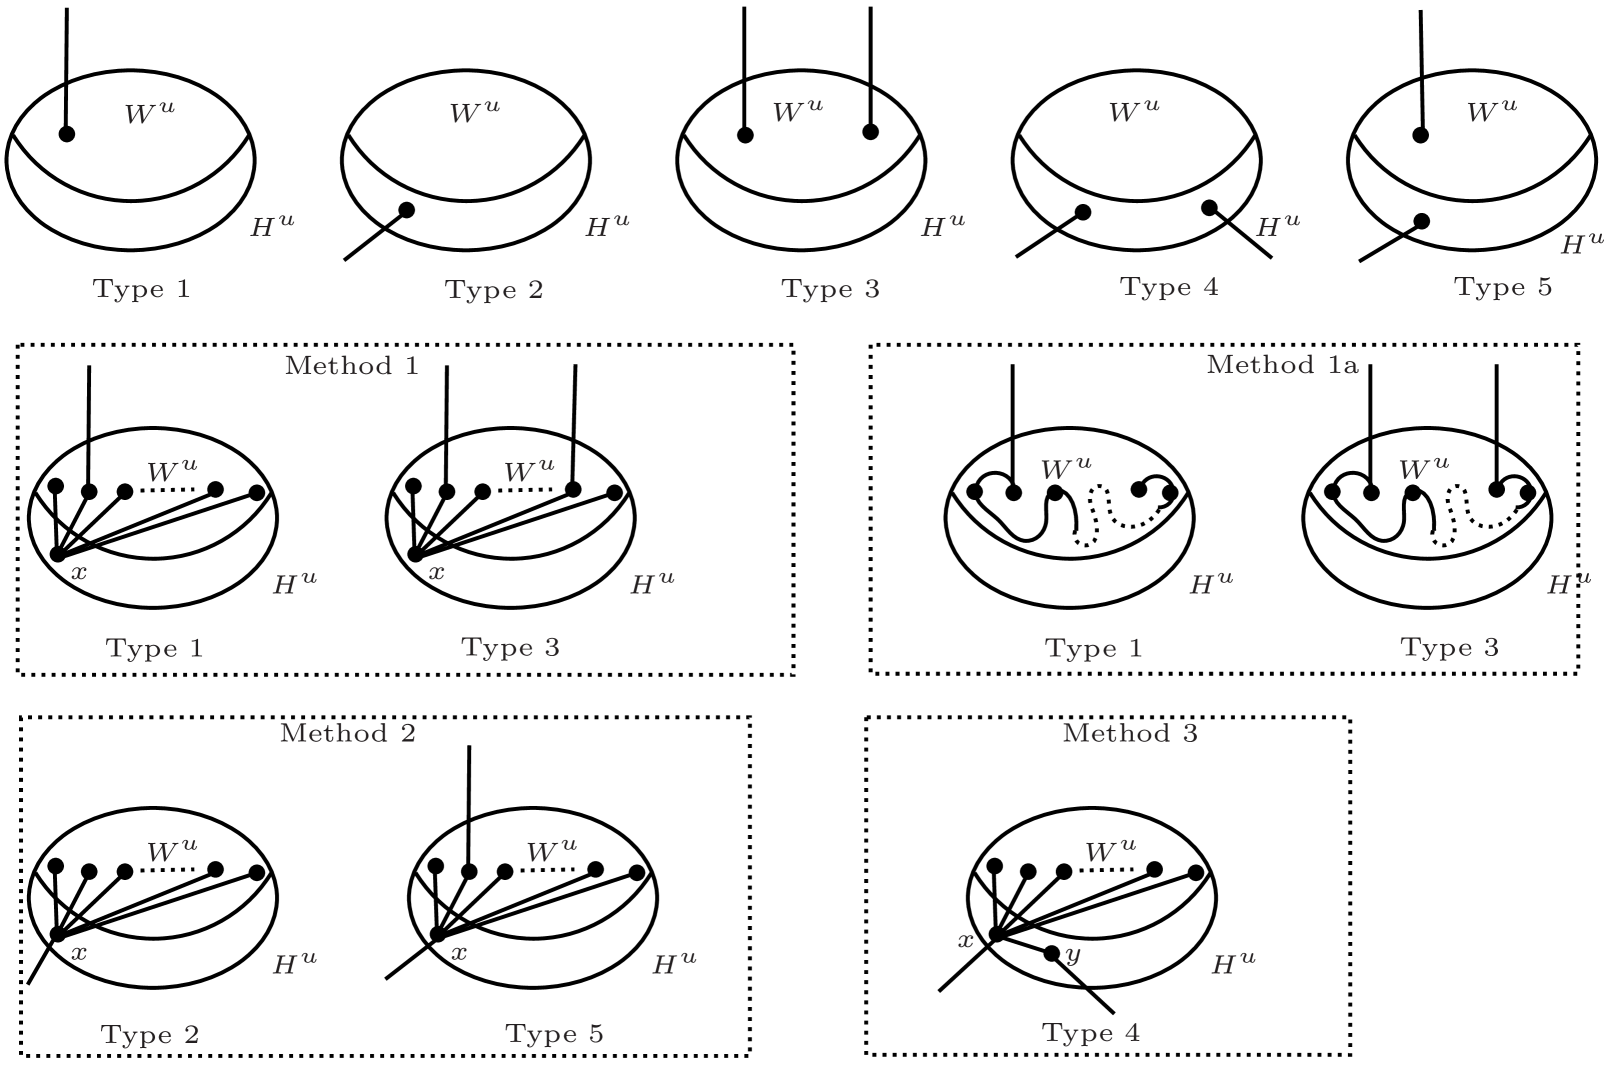
The image presents a diagram illustrating five different types and three methods related to a concept involving 'W<sup>u</sup>' and 'H<sup>u</sup>', likely representing unstable and stable manifolds in dynamical systems theory. The diagram uses circles to represent phase space, with arrows indicating trajectories and points marking specific locations. The diagram is organized into three main sections: a row of five types, and two rows of methods, each showing variations of the types.
### Components/Axes
The diagram consists of:
* Circles: Representing phase space.
* Arrows: Indicating trajectories or flow direction.
* Points: Labeled 'x' and 'y', marking specific locations within the phase space.
* Labels: 'W<sup>u</sup>' and 'H<sup>u</sup>' are consistently present, likely denoting unstable and stable manifolds.
* Type Labels: "Type 1", "Type 2", "Type 3", "Type 4", "Type 5"
* Method Labels: "Method 1", "Method 1a", "Method 2", "Method 3"
* Dotted Lines: Used to indicate approximate or less certain trajectories.
* Colored Regions: In Method 1a, red and green regions are used to highlight areas.
### Detailed Analysis or Content Details
**Top Row: Types**
* **Type 1:** A circle with 'W<sup>u</sup>' above and 'H<sup>u</sup>' below. A single arrow points downwards from 'W<sup>u</sup>' to 'H<sup>u</sup>'.
* **Type 2:** Similar to Type 1, but the arrow from 'W<sup>u</sup>' to 'H<sup>u</sup>' is curved.
* **Type 3:** Similar to Type 1, but the arrow from 'W<sup>u</sup>' to 'H<sup>u</sup>' is curved in the opposite direction.
* **Type 4:** Similar to Type 1, but the arrow from 'W<sup>u</sup>' to 'H<sup>u</sup>' is a short, straight line.
* **Type 5:** Similar to Type 1, but the arrow from 'W<sup>u</sup>' to 'H<sup>u</sup>' is curved and extends beyond the circle.
**Second Row: Method 1**
* **Method 1 - Type 1:** A circle with 'W<sup>u</sup>' above and 'H<sup>u</sup>' below. A dotted line connects a point 'x' on the circle to 'W<sup>u</sup>'. An arrow points downwards from 'W<sup>u</sup>' to 'H<sup>u</sup>'.
* **Method 1 - Type 3:** A circle with 'W<sup>u</sup>' above and 'H<sup>u</sup>' below. A dotted line connects a point 'x' on the circle to 'W<sup>u</sup>'. An arrow points downwards from 'W<sup>u</sup>' to 'H<sup>u</sup>'.
**Third Row: Method 1a**
* **Method 1a - Type 1:** A circle with 'W<sup>u</sup>' above and 'H<sup>u</sup>' below. A wavy dotted line connects 'W<sup>u</sup>' to 'H<sup>u</sup>'. A red region is shown near 'W<sup>u</sup>' and a green region near 'H<sup>u</sup>'.
* **Method 1a - Type 3:** A circle with 'W<sup>u</sup>' above and 'H<sup>u</sup>' below. A wavy dotted line connects 'W<sup>u</sup>' to 'H<sup>u</sup>'. A red region is shown near 'W<sup>u</sup>' and a green region near 'H<sup>u</sup>'.
**Fourth Row: Method 2**
* **Method 2 - Type 2:** A circle with 'W<sup>u</sup>' above and 'H<sup>u</sup>' below. Multiple curved arrows connect 'W<sup>u</sup>' to 'H<sup>u</sup>'. A dotted line connects a point 'x' on the circle to 'W<sup>u</sup>'.
* **Method 2 - Type 5:** A circle with 'W<sup>u</sup>' above and 'H<sup>u</sup>' below. Multiple curved arrows connect 'W<sup>u</sup>' to 'H<sup>u</sup>'. A dotted line connects a point 'x' on the circle to 'W<sup>u</sup>'.
**Fifth Row: Method 3**
* **Method 3 - Type 4:** A circle with 'W<sup>u</sup>' above and 'H<sup>u</sup>' below. Multiple curved arrows connect 'W<sup>u</sup>' to 'H<sup>u</sup>'. A dotted line connects a point 'x' on the circle to 'W<sup>u</sup>', and another dotted line connects a point 'y' on the circle to 'H<sup>u</sup>'.
### Key Observations
* The 'W<sup>u</sup>' and 'H<sup>u</sup>' labels are consistent throughout all diagrams, suggesting they represent fundamental elements of the system.
* The different types vary in the shape and direction of the arrows connecting 'W<sup>u</sup>' and 'H<sup>u</sup>', indicating different dynamical behaviors.
* The methods introduce additional elements like points 'x' and 'y', and dotted lines, potentially representing specific conditions or observations.
* Method 1a uses color-coding (red and green) to highlight regions, possibly indicating different stability or behavior.
### Interpretation
This diagram likely illustrates different scenarios in dynamical systems theory, specifically concerning the relationship between unstable ('W<sup>u</sup>') and stable ('H<sup>u</sup>') manifolds. The types represent different configurations of these manifolds, while the methods demonstrate how specific points or conditions ('x', 'y') influence their behavior.
The variations in arrow shapes and directions suggest different types of bifurcations or stability properties. The introduction of points 'x' and 'y' in Methods 1, 2, and 3 could represent saddle points or other critical points in the system. The color-coding in Method 1a might indicate regions of attraction or repulsion.
The diagram is a visual representation of theoretical concepts, and the specific meaning of each element would depend on the context of the dynamical system being studied. It appears to be a pedagogical tool for understanding the complex interplay between unstable and stable manifolds in different scenarios. The use of dotted lines suggests approximations or less certain trajectories, while solid lines represent more definite behaviors. The overall structure suggests a systematic exploration of different configurations and their implications.